|
Download Data (XLS File) |
|
||||||||
|
||||||||
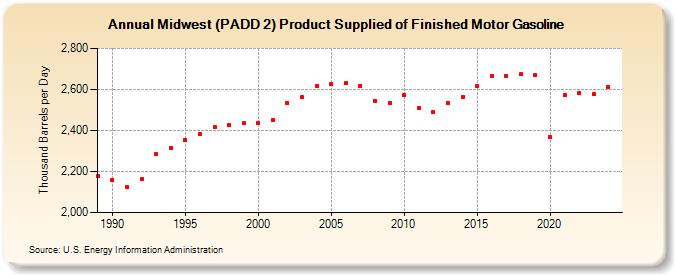
| Midwest (PADD 2) Product Supplied of Finished Motor Gasoline (Thousand Barrels per Day) | ||||||||
| Decade | Year-0 | Year-1 | Year-2 | Year-3 | Year-4 | Year-5 | Year-6 | Year-7 | Year-8 | Year-9 |
|---|---|---|---|---|---|---|---|---|---|---|
| 1980's | 2,176 | |||||||||
| 1990's | 2,159 | 2,124 | 2,164 | 2,283 | 2,316 | 2,352 | 2,381 | 2,417 | 2,426 | 2,434 |
| 2000's | 2,437 | 2,451 | 2,536 | 2,561 | 2,615 | 2,626 | 2,629 | 2,619 | 2,544 | 2,535 |
| 2010's | 2,575 | 2,511 | 2,490 | 2,532 | 2,562 | 2,615 | 2,664 | 2,665 | 2,673 | 2,668 |
| 2020's | 2,368 | 2,572 | 2,582 | 2,580 |
| - = No Data Reported; -- = Not Applicable; NA = Not Available; W = Withheld to avoid disclosure of individual company data. |
| Release Date: 3/29/2024 |
| Next Release Date: 8/30/2024 |