|
Download Data (XLS File) |
|
||||||||
|
||||||||
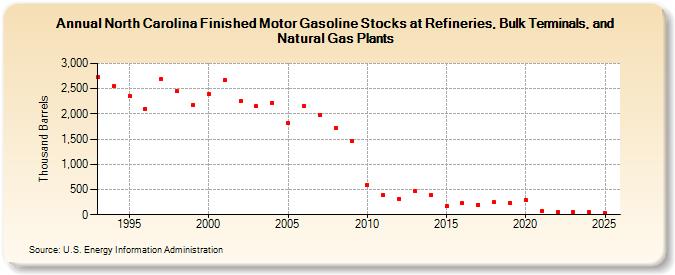
| North Carolina Finished Motor Gasoline Stocks at Refineries, Bulk Terminals, and Natural Gas Plants (Thousand Barrels) | ||||||||
| Decade | Year-0 | Year-1 | Year-2 | Year-3 | Year-4 | Year-5 | Year-6 | Year-7 | Year-8 | Year-9 |
|---|---|---|---|---|---|---|---|---|---|---|
| 1990's | 2,725 | 2,544 | 2,357 | 2,102 | 2,687 | 2,448 | 2,179 | |||
| 2000's | 2,399 | 2,674 | 2,255 | 2,149 | 2,221 | 1,821 | 2,158 | 1,977 | 1,724 | 1,470 |
| 2010's | 591 | 389 | 317 | 466 | 395 | 167 | 232 | 200 | 246 | 239 |
| 2020's | 282 | 74 | 58 | 49 |
| - = No Data Reported; -- = Not Applicable; NA = Not Available; W = Withheld to avoid disclosure of individual company data. |
| Release Date: 3/29/2024 |
| Next Release Date: 8/30/2024 |