|
Download Data (XLS File) |
|
||||||||
|
||||||||
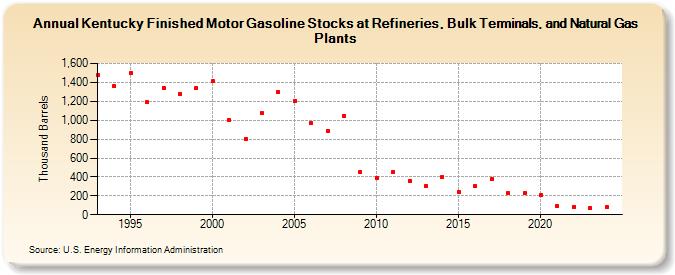
| Kentucky Finished Motor Gasoline Stocks at Refineries, Bulk Terminals, and Natural Gas Plants (Thousand Barrels) | ||||||||
| Decade | Year-0 | Year-1 | Year-2 | Year-3 | Year-4 | Year-5 | Year-6 | Year-7 | Year-8 | Year-9 |
|---|---|---|---|---|---|---|---|---|---|---|
| 1990's | 1,473 | 1,358 | 1,499 | 1,188 | 1,345 | 1,276 | 1,338 | |||
| 2000's | 1,411 | 1,003 | 804 | 1,076 | 1,296 | 1,208 | 969 | 889 | 1,045 | 450 |
| 2010's | 393 | 449 | 360 | 306 | 401 | 238 | 299 | 378 | 228 | 225 |
| 2020's | 208 | 89 | 85 | 73 | 80 |
| - = No Data Reported; -- = Not Applicable; NA = Not Available; W = Withheld to avoid disclosure of individual company data. |
| Release Date: 6/30/2025 |
| Next Release Date: 8/29/2025 |