|
Download Data (XLS File) |
|
||||||||
|
||||||||
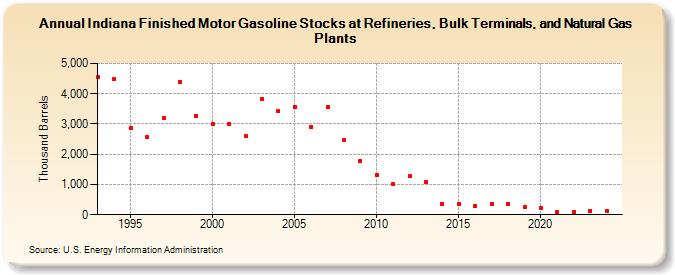
| Indiana Finished Motor Gasoline Stocks at Refineries, Bulk Terminals, and Natural Gas Plants (Thousand Barrels) | ||||||||
| Decade | Year-0 | Year-1 | Year-2 | Year-3 | Year-4 | Year-5 | Year-6 | Year-7 | Year-8 | Year-9 |
|---|---|---|---|---|---|---|---|---|---|---|
| 1990's | 4,561 | 4,492 | 2,870 | 2,575 | 3,207 | 4,402 | 3,257 | |||
| 2000's | 2,992 | 3,015 | 2,608 | 3,827 | 3,413 | 3,570 | 2,908 | 3,560 | 2,464 | 1,786 |
| 2010's | 1,328 | 1,013 | 1,272 | 1,075 | 364 | 341 | 295 | 352 | 347 | 243 |
| 2020's | 224 | 78 | 83 | 125 |
| - = No Data Reported; -- = Not Applicable; NA = Not Available; W = Withheld to avoid disclosure of individual company data. |
| Release Date: 3/29/2024 |
| Next Release Date: 8/30/2024 |