|
Download Data (XLS File) |
|
||||||||
|
||||||||
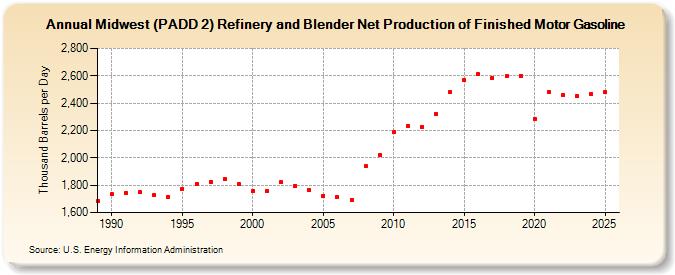
| Midwest (PADD 2) Refinery and Blender Net Production of Finished Motor Gasoline (Thousand Barrels per Day) | ||||||||
| Decade | Year-0 | Year-1 | Year-2 | Year-3 | Year-4 | Year-5 | Year-6 | Year-7 | Year-8 | Year-9 |
|---|---|---|---|---|---|---|---|---|---|---|
| 1980's | 1,683 | |||||||||
| 1990's | 1,734 | 1,745 | 1,748 | 1,728 | 1,717 | 1,775 | 1,810 | 1,823 | 1,843 | 1,806 |
| 2000's | 1,759 | 1,758 | 1,820 | 1,796 | 1,762 | 1,724 | 1,711 | 1,694 | 1,937 | 2,021 |
| 2010's | 2,186 | 2,235 | 2,228 | 2,320 | 2,478 | 2,570 | 2,610 | 2,587 | 2,596 | 2,601 |
| 2020's | 2,287 | 2,483 | 2,458 | 2,451 |
| - = No Data Reported; -- = Not Applicable; NA = Not Available; W = Withheld to avoid disclosure of individual company data. |
| Release Date: 3/29/2024 |
| Next Release Date: 8/30/2024 |