|
Download Data (XLS File) |
|
||||||||
|
||||||||
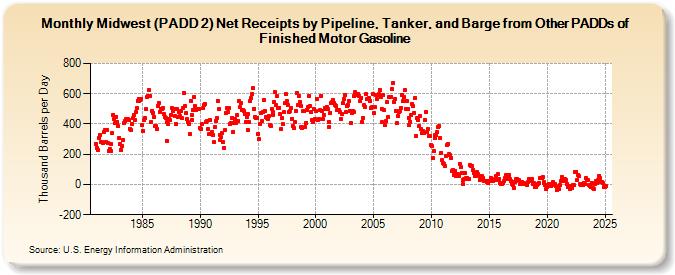
| Midwest (PADD 2) Net Receipts by Pipeline, Tanker, and Barge from Other PADDs of Finished Motor Gasoline (Thousand Barrels per Day) | ||||||||
| Year | Jan | Feb | Mar | Apr | May | Jun | Jul | Aug | Sep | Oct | Nov | Dec |
|---|---|---|---|---|---|---|---|---|---|---|---|---|
| 1981 | 265 | 243 | 228 | 308 | 326 | 284 | 284 | 276 | 346 | 359 | 280 | 359 |
| 1982 | 273 | 223 | 235 | 220 | 268 | 341 | 460 | 431 | 404 | 449 | 416 | 386 |
| 1983 | 308 | 267 | 230 | 255 | 292 | 409 | 419 | 430 | 431 | 430 | 423 | 370 |
| 1984 | 361 | 402 | 439 | 462 | 429 | 478 | 504 | 554 | 567 | 554 | 558 | 568 |
| 1985 | 391 | 352 | 426 | 437 | 499 | 580 | 582 | 625 | 583 | 414 | 489 | 474 |
| 1986 | 448 | 388 | 384 | 369 | 521 | 541 | 481 | 499 | 500 | 503 | 468 | 449 |
| 1987 | 438 | 290 | 415 | 401 | 430 | 425 | 461 | 503 | 489 | 502 | 452 | 397 |
| 1988 | 499 | 449 | 479 | 450 | 483 | 437 | 507 | 605 | 517 | 470 | 430 | 413 |
| 1989 | 399 | 333 | 553 | 460 | 426 | 494 | 579 | 517 | 495 | 502 | 498 | 500 |
| 1990 | 371 | 366 | 397 | 503 | 525 | 534 | 411 | 422 | 368 | 332 | 426 | 331 |
| 1991 | 345 | 325 | 282 | 379 | 421 | 441 | 553 | 498 | 329 | 296 | 311 | 343 |
| 1992 | 280 | 243 | 360 | 475 | 505 | 476 | 503 | 402 | 408 | 442 | 346 | 408 |
| 1993 | 432 | 405 | 458 | 420 | 551 | 509 | 538 | 492 | 495 | 486 | 465 | 414 |
| 1994 | 447 | 362 | 464 | 410 | 550 | 571 | 600 | 637 | 501 | 445 | 438 | 441 |
| 1995 | 336 | 299 | 400 | 470 | 419 | 477 | 559 | 488 | 447 | 442 | 433 | 454 |
| 1996 | 392 | 389 | 499 | 461 | 477 | 545 | 611 | 523 | 584 | 508 | 507 | 464 |
| 1997 | 366 | 437 | 397 | 477 | 536 | 597 | 551 | 526 | 477 | 487 | 504 | 436 |
| 1998 | 384 | 373 | 410 | 489 | 604 | 523 | 582 | 544 | 518 | 382 | 375 | 489 |
| 1999 | 486 | 377 | 409 | 495 | 512 | 587 | 519 | 476 | 425 | 415 | 501 | 434 |
| 2000 | 484 | 567 | 429 | 433 | 490 | 585 | 486 | 433 | 462 | 503 | 499 | 513 |
| 2001 | 497 | 415 | 382 | 473 | 539 | 542 | 557 | 540 | 528 | 519 | 495 | 495 |
| 2002 | 493 | 477 | 435 | 467 | 537 | 565 | 593 | 479 | 520 | 528 | 553 | 489 |
| 2003 | 404 | 474 | 488 | 479 | 582 | 610 | 591 | 601 | 598 | 584 | 549 | 574 |
| 2004 | 413 | 442 | 525 | 515 | 595 | 562 | 563 | 575 | 555 | 504 | 510 | 598 |
| 2005 | 472 | 510 | 594 | 565 | 589 | 596 | 627 | 579 | 502 | 411 | 590 | 492 |
| 2006 | 393 | 420 | 542 | 448 | 580 | 579 | 581 | 631 | 673 | 547 | 564 | 488 |
| 2007 | 405 | 453 | 477 | 488 | 506 | 592 | 549 | 576 | 625 | 501 | 554 | 499 |
| 2008 | 440 | 393 | 415 | 462 | 535 | 517 | 475 | 572 | 319 | 440 | 429 | 387 |
| 2009 | 455 | 369 | 340 | 356 | 342 | 424 | 481 | 345 | 365 | 323 | 320 | 263 |
| 2010 | 255 | 178 | 218 | 324 | 310 | 327 | 346 | 377 | 386 | 305 | 211 | 165 |
| 2011 | 140 | 137 | 120 | 186 | 258 | 266 | 199 | 193 | 177 | 91 | 97 | 63 |
| 2012 | 92 | 55 | 64 | 67 | 59 | 137 | 118 | 79 | 31 | 1 | 35 | 74 |
| 2013 | 42 | 46 | 38 | 38 | 126 | 125 | 123 | 98 | 79 | 57 | 65 | 85 |
| 2014 | 67 | 53 | 28 | 49 | 54 | 43 | 26 | 20 | 22 | 14 | 9 | 21 |
| 2015 | 24 | 42 | 30 | 34 | 26 | 32 | 30 | 57 | 32 | 67 | 37 | 13 |
| 2016 | 4 | 2 | 9 | 21 | 40 | 60 | 37 | 42 | 62 | 34 | 22 | 6 |
| 2017 | -4 | -23 | 19 | 21 | 37 | 34 | 28 | 27 | 0 | 5 | 14 | 5 |
| 2018 | 7 | 1 | 5 | -6 | 16 | 34 | 38 | 24 | 33 | 4 | 8 | -16 |
| 2019 | -18 | -6 | 6 | 13 | 41 | 41 | 46 | 48 | 17 | 8 | -6 | -29 |
| 2020 | -16 | -1 | 3 | -5 | -10 | -6 | 16 | 6 | 2 | -13 | -36 | -24 |
| 2021 | -30 | -4 | 20 | 50 | 28 | 20 | 33 | 28 | 4 | -17 | -13 | -27 |
| 2022 | -15 | -21 | -12 | -1 | -6 | 82 | 85 | 32 | 62 | 53 | 3 | -2 |
| 2023 | 3 | -2 | 9 | 0 | 42 | 30 | 29 | -2 | -9 | -18 | 12 | -22 |
| 2024 | -28 | 5 | 20 | 25 | ||||||||
| - = No Data Reported; -- = Not Applicable; NA = Not Available; W = Withheld to avoid disclosure of individual company data. |
| Release Date: 6/28/2024 |
| Next Release Date: 7/31/2024 |