|
Download Data (XLS File) |
|
||||||||
|
||||||||
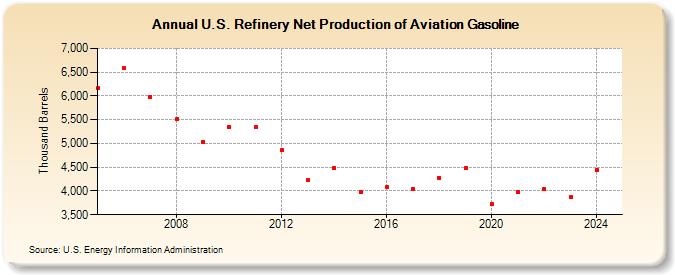
| U.S. Refinery Net Production of Aviation Gasoline (Thousand Barrels) | ||||||||
| Decade | Year-0 | Year-1 | Year-2 | Year-3 | Year-4 | Year-5 | Year-6 | Year-7 | Year-8 | Year-9 |
|---|---|---|---|---|---|---|---|---|---|---|
| 2000's | 6,167 | 6,578 | 5,974 | 5,506 | 5,030 | |||||
| 2010's | 5,354 | 5,336 | 4,859 | 4,224 | 4,490 | 3,973 | 4,080 | 4,038 | 4,279 | 4,482 |
| 2020's | 3,718 | 3,969 | 4,051 | 3,869 |
| - = No Data Reported; -- = Not Applicable; NA = Not Available; W = Withheld to avoid disclosure of individual company data. |
| Release Date: 8/30/2024 |
| Next Release Date: 8/29/2025 |