|
Download Data (XLS File) |
|
||||||||
|
||||||||
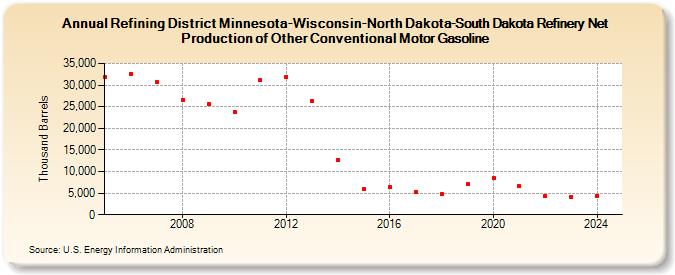
| Refining District Minnesota-Wisconsin-North Dakota-South Dakota Refinery Net Production of Other Conventional Motor Gasoline (Thousand Barrels) | ||||||||
| Decade | Year-0 | Year-1 | Year-2 | Year-3 | Year-4 | Year-5 | Year-6 | Year-7 | Year-8 | Year-9 |
|---|---|---|---|---|---|---|---|---|---|---|
| 2000's | 31,931 | 32,610 | 30,720 | 26,581 | 25,674 | |||||
| 2010's | 23,840 | 31,095 | 31,891 | 26,305 | 12,725 | 5,892 | 6,452 | 5,251 | 4,770 | 7,010 |
| 2020's | 8,457 | 6,590 | 4,301 | 4,130 |
| - = No Data Reported; -- = Not Applicable; NA = Not Available; W = Withheld to avoid disclosure of individual company data. |
| Release Date: 6/28/2024 |
| Next Release Date: 8/30/2024 |