|
Download Data (XLS File) |
|
||||||||
|
||||||||
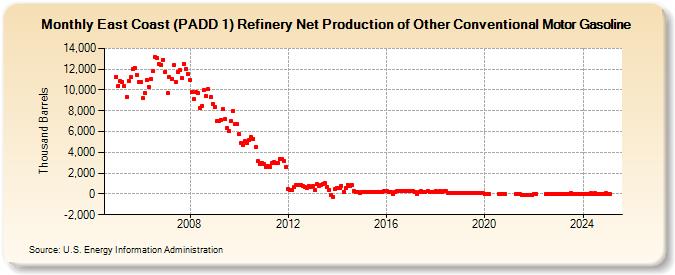
| East Coast (PADD 1) Refinery Net Production of Other Conventional Motor Gasoline (Thousand Barrels) | ||||||||
| Year | Jan | Feb | Mar | Apr | May | Jun | Jul | Aug | Sep | Oct | Nov | Dec |
|---|---|---|---|---|---|---|---|---|---|---|---|---|
| 2005 | 11,280 | 10,424 | 10,842 | 10,754 | 10,380 | 9,347 | 10,877 | 11,231 | 11,993 | 12,116 | 11,477 | 10,792 |
| 2006 | 10,742 | 9,193 | 9,739 | 10,925 | 10,313 | 11,083 | 11,820 | 13,171 | 13,086 | 12,518 | 12,446 | 12,927 |
| 2007 | 11,752 | 9,681 | 11,237 | 11,065 | 12,360 | 10,813 | 11,747 | 11,965 | 11,144 | 12,535 | 12,037 | 11,540 |
| 2008 | 10,945 | 9,845 | 9,144 | 9,849 | 9,674 | 8,250 | 8,466 | 9,953 | 9,389 | 10,060 | 9,310 | 8,677 |
| 2009 | 8,340 | 6,978 | 7,026 | 7,141 | 8,145 | 7,202 | 6,313 | 6,099 | 6,968 | 7,982 | 6,735 | 6,717 |
| 2010 | 5,737 | 4,928 | 4,720 | 5,086 | 4,892 | 5,205 | 5,430 | 5,275 | 4,521 | 3,127 | 2,922 | 3,002 |
| 2011 | 2,842 | 2,570 | 2,729 | 2,637 | 2,955 | 3,031 | 2,958 | 2,977 | 3,376 | 3,329 | 3,145 | 2,618 |
| 2012 | 448 | 422 | 333 | 674 | 862 | 811 | 884 | 769 | 691 | 529 | 743 | 637 |
| 2013 | 769 | 408 | 917 | 749 | 854 | 969 | 1,047 | 674 | 420 | -108 | -298 | 512 |
| 2014 | 550 | 555 | 799 | 221 | 547 | 903 | 794 | 894 | 299 | 217 | 195 | 87 |
| 2015 | 223 | 213 | 212 | 196 | 153 | 164 | 179 | 198 | 196 | 143 | 205 | 237 |
| 2016 | 235 | 213 | 217 | 35 | 192 | 243 | 256 | 240 | 243 | 271 | 263 | 239 |
| 2017 | 276 | 252 | 216 | 32 | 223 | 250 | 227 | 229 | 244 | 198 | 227 | 167 |
| 2018 | 256 | 226 | 284 | 222 | 242 | 248 | 74 | 51 | 85 | 93 | 68 | 67 |
| 2019 | 64 | 72 | 75 | 44 | 48 | 79 | 67 | 69 | 105 | 78 | 59 | 70 |
| 2020 | 0 | 0 | 8 | -11 | -13 | 14 | -19 | |||||
| 2021 | -17 | -10 | -2 | -70 | -101 | -69 | -82 | -72 | -70 | |||
| 2022 | -18 | -14 | -15 | 3 | 5 | 10 | -6 | -24 | ||||
| 2023 | 37 | 24 | 4 | 4 | 35 | 27 | 43 | 4 | 9 | 13 | 20 | 38 |
| 2024 | 13 | |||||||||||
| - = No Data Reported; -- = Not Applicable; NA = Not Available; W = Withheld to avoid disclosure of individual company data. |
| Release Date: 3/29/2024 |
| Next Release Date: 4/30/2024 |