|
Download Data (XLS File) |
|
||||||||
|
||||||||
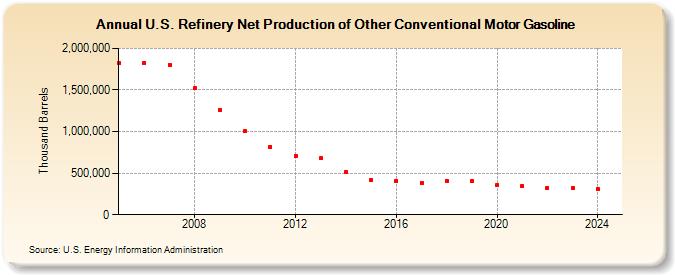
| U.S. Refinery Net Production of Other Conventional Motor Gasoline (Thousand Barrels) | ||||||||
| Decade | Year-0 | Year-1 | Year-2 | Year-3 | Year-4 | Year-5 | Year-6 | Year-7 | Year-8 | Year-9 |
|---|---|---|---|---|---|---|---|---|---|---|
| 2000's | 1,823,996 | 1,824,354 | 1,804,351 | 1,519,552 | 1,256,415 | |||||
| 2010's | 1,009,107 | 819,471 | 707,862 | 677,063 | 519,450 | 421,435 | 406,015 | 384,689 | 410,186 | 404,586 |
| 2020's | 358,088 | 346,651 | 324,567 | 320,214 |
| - = No Data Reported; -- = Not Applicable; NA = Not Available; W = Withheld to avoid disclosure of individual company data. |
| Release Date: 6/28/2024 |
| Next Release Date: 8/30/2024 |