|
Download Data (XLS File) |
|
||||||||
|
||||||||
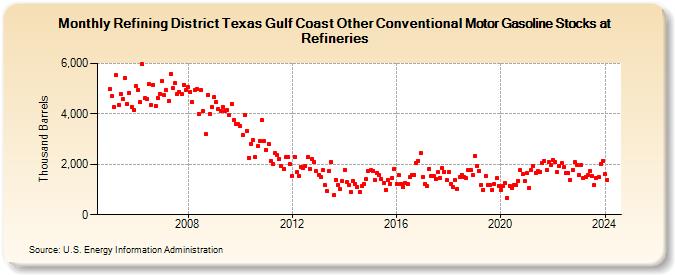
| Refining District Texas Gulf Coast Other Conventional Motor Gasoline Stocks at Refineries (Thousand Barrels) | ||||||||
| Year | Jan | Feb | Mar | Apr | May | Jun | Jul | Aug | Sep | Oct | Nov | Dec |
|---|---|---|---|---|---|---|---|---|---|---|---|---|
| 2005 | 4,989 | 4,709 | 4,255 | 5,532 | 4,359 | 4,805 | 4,601 | 5,440 | 4,397 | 4,848 | 4,292 | 4,146 |
| 2006 | 5,096 | 4,962 | 4,456 | 5,967 | 4,616 | 4,588 | 5,172 | 4,351 | 5,166 | 4,322 | 4,619 | 4,804 |
| 2007 | 5,295 | 4,736 | 4,929 | 4,509 | 5,575 | 5,037 | 5,241 | 4,777 | 4,874 | 4,787 | 5,166 | 4,947 |
| 2008 | 5,064 | 4,884 | 4,463 | 4,929 | 4,976 | 4,012 | 4,934 | 4,104 | 3,185 | 4,750 | 4,004 | 4,271 |
| 2009 | 4,664 | 4,454 | 4,198 | 4,134 | 4,276 | 4,104 | 4,161 | 3,941 | 4,398 | 3,767 | 3,610 | 3,586 |
| 2010 | 3,515 | 3,180 | 3,941 | 3,330 | 2,267 | 2,804 | 2,953 | 2,280 | 2,712 | 2,935 | 3,745 | 2,920 |
| 2011 | 2,569 | 2,813 | 2,149 | 2,027 | 2,438 | 2,356 | 2,224 | 1,925 | 1,816 | 2,298 | 2,298 | 1,996 |
| 2012 | 1,539 | 2,305 | 1,678 | 1,536 | 1,901 | 1,868 | 1,925 | 2,283 | 1,830 | 2,198 | 2,096 | 1,721 |
| 2013 | 1,594 | 1,502 | 1,764 | 1,172 | 931 | 1,742 | 2,082 | 764 | 1,396 | 1,197 | 1,001 | 1,337 |
| 2014 | 1,780 | 1,297 | 1,187 | 919 | 1,331 | 1,232 | 1,097 | 895 | 1,136 | 1,224 | 1,398 | 1,745 |
| 2015 | 1,757 | 1,728 | 1,379 | 1,671 | 1,575 | 1,409 | 1,271 | 999 | 1,395 | 1,223 | 1,476 | 1,829 |
| 2016 | 1,232 | 1,564 | 1,230 | 1,092 | 1,254 | 1,210 | 1,477 | 1,572 | 1,590 | 2,046 | 2,145 | 2,429 |
| 2017 | 1,509 | 1,225 | 1,122 | 1,833 | 1,523 | 1,549 | 1,424 | 1,684 | 1,459 | 1,856 | 1,713 | 1,367 |
| 2018 | 1,675 | 1,237 | 1,086 | 1,377 | 1,024 | 1,485 | 1,595 | 1,489 | 1,440 | 1,782 | 1,758 | 1,587 |
| 2019 | 2,332 | 1,918 | 1,727 | 1,186 | 999 | 1,543 | 1,171 | 1,178 | 995 | 1,220 | 1,455 | 1,131 |
| 2020 | 991 | 1,148 | 1,268 | 660 | 1,147 | 1,048 | 1,188 | 1,180 | 1,347 | 1,771 | 1,622 | 1,326 |
| 2021 | 1,636 | 1,068 | 1,766 | 1,931 | 1,667 | 1,733 | 1,698 | 2,062 | 2,140 | 1,793 | 2,083 | 1,973 |
| 2022 | 2,177 | 2,087 | 1,677 | 1,938 | 2,033 | 1,878 | 1,651 | 1,663 | 1,372 | 1,783 | 2,087 | 1,979 |
| 2023 | 1,587 | 1,991 | 1,463 | 1,503 | 1,568 | 1,741 | 1,549 | 1,160 | 1,473 | 1,488 | 2,010 | 2,147 |
| 2024 | 1,608 | 1,382 | 1,023 | 1,074 | ||||||||
| - = No Data Reported; -- = Not Applicable; NA = Not Available; W = Withheld to avoid disclosure of individual company data. |
| Release Date: 6/28/2024 |
| Next Release Date: 7/31/2024 |