|
Download Data (XLS File) |
|
||||||||
|
||||||||
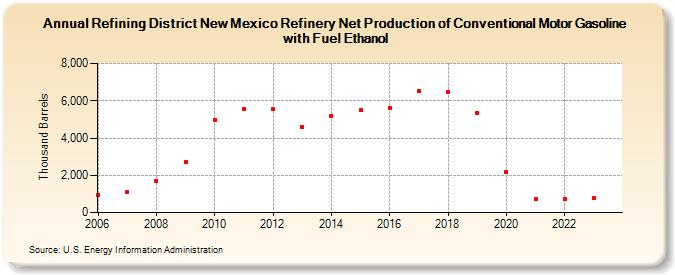
| Refining District New Mexico Refinery Net Production of Conventional Motor Gasoline with Fuel Ethanol (Thousand Barrels) | ||||||||
| Decade | Year-0 | Year-1 | Year-2 | Year-3 | Year-4 | Year-5 | Year-6 | Year-7 | Year-8 | Year-9 |
|---|---|---|---|---|---|---|---|---|---|---|
| 2000's | 963 | 1,128 | 1,711 | 2,709 | ||||||
| 2010's | 4,972 | 5,560 | 5,563 | 4,602 | 5,205 | 5,497 | 5,602 | 6,536 | 6,486 | 5,343 |
| 2020's | 2,157 | 718 | 748 | 783 |
| - = No Data Reported; -- = Not Applicable; NA = Not Available; W = Withheld to avoid disclosure of individual company data. |
| Release Date: 6/28/2024 |
| Next Release Date: 8/30/2024 |