|
Download Data (XLS File) |
|
||||||||
|
||||||||
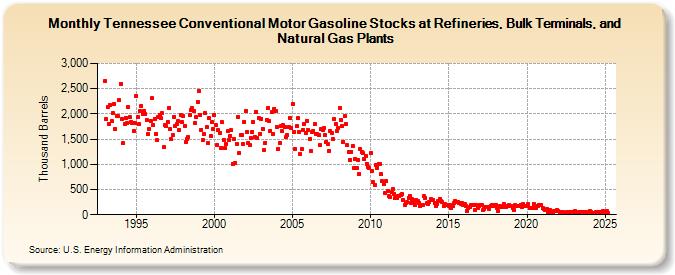
| Tennessee Conventional Motor Gasoline Stocks at Refineries, Bulk Terminals, and Natural Gas Plants (Thousand Barrels) | ||||||||
| Year | Jan | Feb | Mar | Apr | May | Jun | Jul | Aug | Sep | Oct | Nov | Dec |
|---|---|---|---|---|---|---|---|---|---|---|---|---|
| 1993 | 2,654 | 1,891 | 2,140 | 1,803 | 2,183 | 1,868 | 2,016 | 2,204 | 1,704 | 1,967 | 1,949 | 2,267 |
| 1994 | 2,597 | 1,905 | 1,414 | 1,802 | 1,924 | 1,813 | 2,127 | 1,935 | 1,846 | 1,820 | 1,662 | 1,812 |
| 1995 | 2,359 | 1,938 | 1,792 | 2,048 | 2,163 | 1,988 | 2,054 | 1,999 | 1,882 | 1,601 | 1,695 | 1,866 |
| 1996 | 2,308 | 1,780 | 1,904 | 1,600 | 1,475 | 1,933 | 1,984 | 1,910 | 2,008 | 1,340 | 1,779 | 1,759 |
| 1997 | 1,842 | 2,122 | 1,693 | 1,494 | 1,575 | 1,945 | 1,760 | 1,792 | 1,850 | 1,676 | 1,977 | 1,836 |
| 1998 | 1,955 | 1,761 | 1,438 | 1,502 | 1,538 | 1,969 | 2,070 | 2,118 | 2,054 | 1,823 | 1,929 | 2,236 |
| 1999 | 2,462 | 1,979 | 1,687 | 1,475 | 1,603 | 2,017 | 1,742 | 1,414 | 1,918 | 1,566 | 1,832 | 1,699 |
| 2000 | 1,986 | 1,779 | 1,385 | 1,671 | 1,619 | 1,324 | 1,831 | 1,491 | 1,318 | 1,402 | 1,654 | 1,487 |
| 2001 | 1,571 | 1,674 | 1,012 | 1,497 | 1,034 | 1,410 | 1,947 | 1,225 | 1,572 | 1,579 | 1,398 | 1,847 |
| 2002 | 2,061 | 1,648 | 1,427 | 1,374 | 1,518 | 1,645 | 1,839 | 1,547 | 2,041 | 1,517 | 1,914 | 1,597 |
| 2003 | 1,903 | 1,710 | 1,289 | 1,432 | 1,884 | 2,114 | 1,858 | 1,667 | 2,032 | 1,608 | 2,105 | 2,055 |
| 2004 | 1,745 | 1,304 | 1,426 | 1,760 | 1,660 | 1,774 | 1,743 | 1,549 | 1,578 | 1,740 | 1,915 | 1,729 |
| 2005 | 2,201 | 1,650 | 1,309 | 1,755 | 1,912 | 1,642 | 1,195 | 1,303 | 1,689 | 1,801 | 1,617 | 1,863 |
| 2006 | 1,680 | 1,498 | 1,272 | 1,639 | 1,663 | 1,801 | 1,593 | 1,597 | 1,577 | 1,380 | 1,700 | 1,676 |
| 2007 | 1,718 | 1,583 | 1,443 | 1,402 | 1,270 | 1,656 | 1,627 | 1,503 | 1,902 | 1,797 | 1,666 | 1,725 |
| 2008 | 2,110 | 1,886 | 1,756 | 1,452 | 1,951 | 1,800 | 1,374 | 1,248 | 1,095 | 1,250 | 1,365 | 923 |
| 2009 | 1,108 | 919 | 1,089 | 808 | 1,302 | 1,236 | 1,216 | 1,098 | 1,165 | 1,012 | 942 | 936 |
| 2010 | 1,220 | 877 | 643 | 585 | 984 | 936 | 1,006 | 1,008 | 807 | 661 | 605 | 437 |
| 2011 | 663 | 461 | 375 | 344 | 441 | 508 | 412 | 326 | 324 | 367 | 378 | 397 |
| 2012 | 406 | 288 | 200 | 240 | 252 | 341 | 378 | 241 | 305 | 245 | 197 | 288 |
| 2013 | 265 | 238 | 168 | 190 | 191 | 362 | 340 | 232 | 210 | 259 | 307 | 291 |
| 2014 | 297 | 241 | 181 | 221 | 273 | 321 | 265 | 243 | 163 | 205 | 198 | 183 |
| 2015 | 181 | 198 | 126 | 178 | 240 | 273 | 256 | 257 | 228 | 208 | 231 | 193 |
| 2016 | 208 | 178 | 74 | 133 | 154 | 188 | 184 | 184 | 102 | 191 | 135 | 182 |
| 2017 | 200 | 192 | 84 | 115 | 160 | 147 | 150 | 114 | 179 | 187 | 163 | 195 |
| 2018 | 188 | 130 | 74 | 170 | 155 | 149 | 222 | 162 | 159 | 174 | 186 | 168 |
| 2019 | 172 | 137 | 102 | 183 | 171 | 178 | 178 | 199 | 160 | 206 | 176 | 178 |
| 2020 | 173 | 209 | 129 | 124 | 138 | 209 | 132 | 139 | 181 | 199 | 202 | 194 |
| 2021 | 128 | 122 | 91 | 113 | 54 | 57 | 91 | 46 | 39 | 73 | 74 | 84 |
| 2022 | 70 | 52 | 63 | 48 | 48 | 29 | 30 | 44 | 37 | 54 | 60 | 49 |
| 2023 | 48 | 69 | 30 | 38 | 53 | 54 | 54 | 56 | 52 | 43 | 49 | 56 |
| 2024 | 76 | 58 | 40 | 36 | ||||||||
| - = No Data Reported; -- = Not Applicable; NA = Not Available; W = Withheld to avoid disclosure of individual company data. |
| Release Date: 6/28/2024 |
| Next Release Date: 7/31/2024 |