|
Download Data (XLS File) |
|
||||||||
|
||||||||
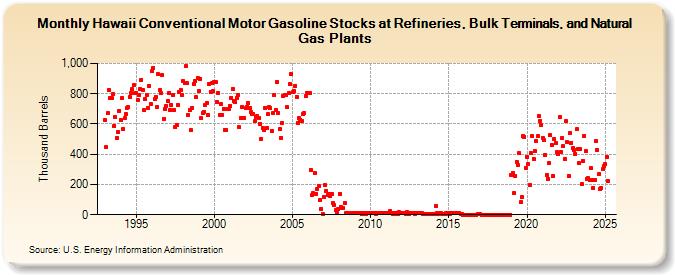
| Hawaii Conventional Motor Gasoline Stocks at Refineries, Bulk Terminals, and Natural Gas Plants (Thousand Barrels) | ||||||||
| Year | Jan | Feb | Mar | Apr | May | Jun | Jul | Aug | Sep | Oct | Nov | Dec |
|---|---|---|---|---|---|---|---|---|---|---|---|---|
| 1993 | 627 | 445 | 670 | 823 | 773 | 773 | 797 | 589 | 644 | 508 | 546 | 688 |
| 1994 | 625 | 775 | 570 | 639 | 667 | 708 | 712 | 781 | 802 | 828 | 856 | 802 |
| 1995 | 804 | 758 | 789 | 830 | 893 | 825 | 692 | 762 | 790 | 706 | 852 | 733 |
| 1996 | 950 | 970 | 764 | 779 | 715 | 928 | 823 | 803 | 923 | 635 | 702 | 721 |
| 1997 | 752 | 806 | 691 | 726 | 794 | 691 | 577 | 596 | 725 | 812 | 824 | 789 |
| 1998 | 881 | 868 | 981 | 869 | 662 | 691 | 557 | 706 | 867 | 887 | 776 | 902 |
| 1999 | 819 | 900 | 639 | 673 | 682 | 727 | 741 | 658 | 867 | 814 | 869 | 817 |
| 2000 | 878 | 876 | 744 | 804 | 659 | 732 | 662 | 700 | 562 | 561 | 701 | 698 |
| 2001 | 720 | 774 | 834 | 755 | 744 | 773 | 793 | 577 | 639 | 713 | 641 | 638 |
| 2002 | 706 | 715 | 737 | 704 | 676 | 669 | 668 | 618 | 643 | 650 | 642 | 602 |
| 2003 | 503 | 576 | 560 | 708 | 572 | 664 | 710 | 704 | 556 | 670 | 791 | 695 |
| 2004 | 878 | 672 | 566 | 510 | 608 | 786 | 792 | 790 | 709 | 803 | 864 | 929 |
| 2005 | 810 | 820 | 854 | 780 | 608 | 640 | 627 | 619 | 663 | 671 | 784 | 805 |
| 2006 | 808 | 803 | 296 | 130 | 141 | 276 | 139 | 172 | 190 | 97 | 41 | 8 |
| 2007 | 119 | 194 | 158 | 129 | 139 | 123 | 139 | 76 | 61 | 29 | 10 | 35 |
| 2008 | 136 | 54 | 45 | 43 | 79 | 9 | 11 | 11 | 11 | 11 | 12 | 12 |
| 2009 | 11 | 10 | 12 | 11 | 10 | 8 | 9 | 9 | 4 | 14 | 14 | 9 |
| 2010 | 10 | 9 | 9 | 9 | 8 | 12 | 12 | 12 | 12 | 12 | 11 | 11 |
| 2011 | 12 | 12 | 9 | 23 | 14 | 6 | 14 | 6 | 14 | 7 | 16 | 10 |
| 2012 | 11 | 11 | 14 | 5 | 15 | 7 | 12 | 12 | 13 | 10 | 7 | 11 |
| 2013 | 11 | 10 | 10 | 9 | 3 | 7 | 7 | 7 | 5 | 4 | 3 | 8 |
| 2014 | 3 | 6 | 59 | 9 | 7 | 10 | 9 | 7 | 6 | 4 | 12 | 10 |
| 2015 | 8 | 6 | 11 | 9 | 11 | 12 | 10 | 10 | 12 | 6 | 7 | 1 |
| 2016 | 1 | 1 | 1 | 1 | 1 | 1 | 1 | 1 | 1 | 1 | 2 | 2 |
| 2017 | 2 | 1 | 1 | 1 | 1 | 1 | 1 | 1 | 1 | 1 | 1 | 1 |
| 2018 | 1 | 1 | 1 | 1 | 1 | 1 | 1 | 1 | 1 | 1 | 1 | |
| 2019 | 262 | 279 | 142 | 255 | 349 | 327 | 406 | 82 | 117 | 519 | 516 | 312 |
| 2020 | 384 | 335 | 197 | 409 | 519 | 370 | 422 | 485 | 518 | 650 | 622 | 590 |
| 2021 | 510 | 494 | 395 | 261 | 237 | 343 | 525 | 461 | 257 | 501 | 473 | 413 |
| 2022 | 400 | 646 | 417 | 508 | 452 | 370 | 617 | 482 | 258 | 543 | 476 | 438 |
| 2023 | 427 | 416 | 564 | 435 | 340 | 432 | 201 | 358 | 523 | 418 | 268 | 240 |
| 2024 | 231 | 308 | 228 | 177 | ||||||||
| - = No Data Reported; -- = Not Applicable; NA = Not Available; W = Withheld to avoid disclosure of individual company data. |
| Release Date: 6/28/2024 |
| Next Release Date: 7/31/2024 |