|
Download Data (XLS File) |
|
||||||||
|
||||||||
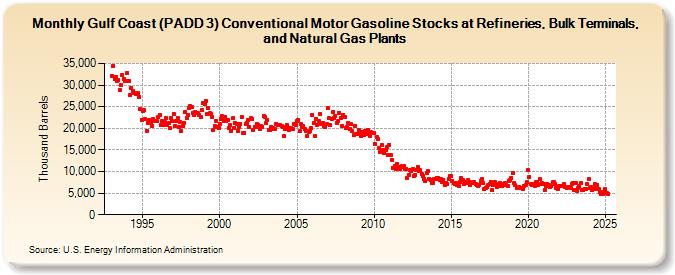
| Gulf Coast (PADD 3) Conventional Motor Gasoline Stocks at Refineries, Bulk Terminals, and Natural Gas Plants (Thousand Barrels) | ||||||||
| Year | Jan | Feb | Mar | Apr | May | Jun | Jul | Aug | Sep | Oct | Nov | Dec |
|---|---|---|---|---|---|---|---|---|---|---|---|---|
| 1993 | 32,106 | 34,519 | 31,411 | 31,884 | 30,833 | 31,270 | 28,950 | 29,915 | 32,357 | 31,460 | 30,997 | 31,001 |
| 1994 | 32,815 | 30,874 | 27,592 | 29,432 | 28,688 | 28,106 | 28,159 | 27,959 | 28,087 | 27,357 | 24,388 | 21,946 |
| 1995 | 23,957 | 24,232 | 22,106 | 19,454 | 21,303 | 21,997 | 21,466 | 20,608 | 22,070 | 21,685 | 21,677 | 21,643 |
| 1996 | 22,515 | 23,181 | 20,685 | 21,785 | 20,675 | 21,391 | 22,292 | 20,728 | 21,130 | 20,123 | 22,293 | 21,623 |
| 1997 | 23,325 | 20,516 | 21,604 | 22,370 | 20,321 | 21,528 | 19,326 | 20,488 | 21,338 | 23,677 | 22,445 | 22,972 |
| 1998 | 24,695 | 25,095 | 24,996 | 23,638 | 23,088 | 23,829 | 23,631 | 23,525 | 23,026 | 22,585 | 24,213 | 25,857 |
| 1999 | 25,617 | 26,371 | 23,244 | 24,701 | 23,456 | 23,258 | 22,612 | 19,656 | 20,498 | 21,760 | 20,209 | 19,994 |
| 2000 | 21,049 | 22,043 | 22,769 | 21,755 | 22,568 | 21,751 | 21,982 | 19,983 | 20,747 | 19,420 | 22,326 | 20,152 |
| 2001 | 21,289 | 20,998 | 19,478 | 20,359 | 21,091 | 22,620 | 18,925 | 18,980 | 21,042 | 21,145 | 21,976 | 20,258 |
| 2002 | 22,272 | 22,053 | 19,687 | 20,214 | 20,409 | 21,093 | 20,789 | 19,912 | 20,632 | 20,360 | 22,943 | 22,508 |
| 2003 | 21,127 | 21,850 | 19,639 | 19,646 | 20,348 | 20,026 | 19,742 | 19,899 | 20,939 | 20,693 | 20,688 | 20,695 |
| 2004 | 20,578 | 20,296 | 18,148 | 19,844 | 20,735 | 20,177 | 19,659 | 20,001 | 19,738 | 19,725 | 20,993 | 20,864 |
| 2005 | 21,749 | 21,920 | 19,314 | 20,883 | 20,397 | 20,437 | 19,946 | 19,408 | 18,211 | 19,215 | 19,428 | 20,029 |
| 2006 | 23,098 | 21,234 | 18,250 | 22,213 | 20,868 | 21,703 | 23,307 | 20,987 | 21,137 | 20,590 | 20,217 | 21,011 |
| 2007 | 24,608 | 22,322 | 20,659 | 22,240 | 23,842 | 22,341 | 22,928 | 21,267 | 21,785 | 23,585 | 22,427 | 20,526 |
| 2008 | 23,191 | 22,673 | 20,057 | 20,413 | 21,285 | 19,833 | 20,909 | 19,321 | 18,373 | 20,568 | 18,728 | 18,570 |
| 2009 | 19,511 | 18,662 | 18,290 | 19,110 | 18,490 | 19,486 | 18,747 | 19,512 | 18,601 | 18,283 | 19,134 | 18,853 |
| 2010 | 18,895 | 16,372 | 17,878 | 17,513 | 15,394 | 14,628 | 16,077 | 14,983 | 14,228 | 14,929 | 15,615 | 13,904 |
| 2011 | 16,227 | 13,744 | 12,733 | 10,800 | 11,266 | 10,593 | 11,752 | 10,959 | 10,575 | 11,143 | 11,387 | 11,262 |
| 2012 | 10,599 | 10,503 | 8,612 | 9,286 | 10,300 | 10,031 | 10,472 | 8,865 | 9,277 | 10,286 | 11,065 | 10,201 |
| 2013 | 10,290 | 9,320 | 8,940 | 8,379 | 7,759 | 9,542 | 10,034 | 8,301 | 7,978 | 7,368 | 7,293 | 8,300 |
| 2014 | 8,276 | 8,601 | 8,514 | 8,099 | 8,150 | 7,644 | 8,123 | 6,812 | 7,407 | 7,118 | 8,241 | 8,873 |
| 2015 | 8,941 | 7,821 | 7,400 | 7,127 | 7,296 | 6,816 | 6,606 | 7,483 | 8,462 | 8,061 | 7,121 | 7,620 |
| 2016 | 7,254 | 7,998 | 7,441 | 6,889 | 7,651 | 7,234 | 7,481 | 7,026 | 6,828 | 6,536 | 6,946 | 7,894 |
| 2017 | 8,255 | 7,266 | 5,992 | 6,283 | 6,360 | 6,852 | 7,146 | 7,657 | 5,659 | 6,844 | 7,469 | 7,218 |
| 2018 | 6,343 | 6,550 | 7,387 | 6,721 | 6,594 | 7,071 | 7,228 | 6,772 | 6,733 | 7,850 | 8,137 | 8,538 |
| 2019 | 9,687 | 7,384 | 6,768 | 6,237 | 6,091 | 6,483 | 6,137 | 6,206 | 5,980 | 6,643 | 6,766 | 7,479 |
| 2020 | 10,296 | 8,794 | 6,996 | 6,989 | 7,134 | 6,548 | 7,566 | 7,590 | 6,915 | 8,204 | 7,137 | 7,295 |
| 2021 | 7,170 | 5,781 | 6,622 | 7,027 | 6,963 | 6,364 | 6,634 | 7,466 | 7,616 | 7,097 | 6,205 | 5,998 |
| 2022 | 6,622 | 6,661 | 6,568 | 6,695 | 6,997 | 6,372 | 6,178 | 6,350 | 6,320 | 6,206 | 7,204 | 7,427 |
| 2023 | 5,860 | 7,395 | 5,463 | 6,155 | 6,546 | 7,360 | 5,748 | 5,030 | 5,498 | 5,998 | 7,069 | 8,313 |
| 2024 | 6,069 | 6,321 | 5,693 | 6,191 | ||||||||
| - = No Data Reported; -- = Not Applicable; NA = Not Available; W = Withheld to avoid disclosure of individual company data. |
| Release Date: 6/28/2024 |
| Next Release Date: 7/31/2024 |