|
Download Data (XLS File) |
|
||||||||
|
||||||||
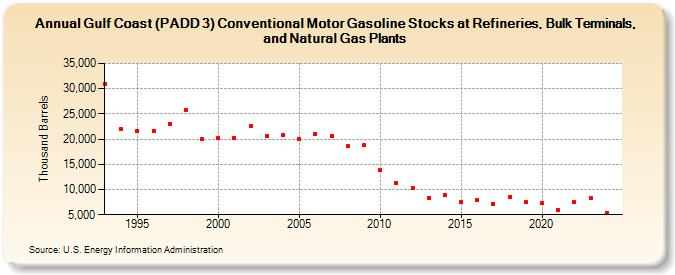
| Gulf Coast (PADD 3) Conventional Motor Gasoline Stocks at Refineries, Bulk Terminals, and Natural Gas Plants (Thousand Barrels) | ||||||||
| Decade | Year-0 | Year-1 | Year-2 | Year-3 | Year-4 | Year-5 | Year-6 | Year-7 | Year-8 | Year-9 |
|---|---|---|---|---|---|---|---|---|---|---|
| 1990's | 31,001 | 21,946 | 21,643 | 21,623 | 22,972 | 25,857 | 19,994 | |||
| 2000's | 20,152 | 20,258 | 22,508 | 20,695 | 20,864 | 20,029 | 21,011 | 20,526 | 18,570 | 18,853 |
| 2010's | 13,904 | 11,262 | 10,201 | 8,300 | 8,873 | 7,620 | 7,894 | 7,218 | 8,538 | 7,479 |
| 2020's | 7,295 | 5,998 | 7,427 | 8,313 |
| - = No Data Reported; -- = Not Applicable; NA = Not Available; W = Withheld to avoid disclosure of individual company data. |
| Release Date: 6/28/2024 |
| Next Release Date: 8/30/2024 |