|
Download Data (XLS File) |
|
||||||||
|
||||||||
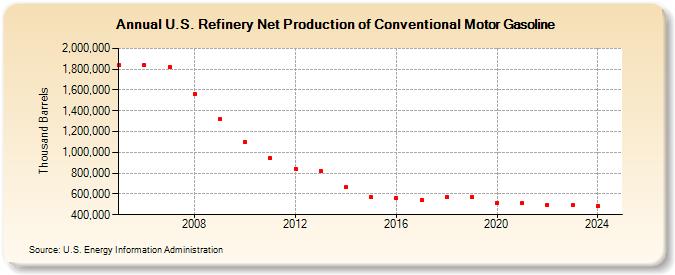
| U.S. Refinery Net Production of Conventional Motor Gasoline (Thousand Barrels) | ||||||||
| Decade | Year-0 | Year-1 | Year-2 | Year-3 | Year-4 | Year-5 | Year-6 | Year-7 | Year-8 | Year-9 |
|---|---|---|---|---|---|---|---|---|---|---|
| 2000's | 1,836,968 | 1,839,663 | 1,821,953 | 1,561,931 | 1,316,658 | |||||
| 2010's | 1,103,911 | 944,143 | 842,540 | 821,992 | 662,104 | 569,021 | 563,661 | 542,240 | 570,210 | 574,121 |
| 2020's | 514,612 | 512,111 | 493,508 | 490,973 |
| - = No Data Reported; -- = Not Applicable; NA = Not Available; W = Withheld to avoid disclosure of individual company data. |
| Release Date: 6/28/2024 |
| Next Release Date: 8/30/2024 |