|
Download Data (XLS File) |
|
||||||||
|
||||||||
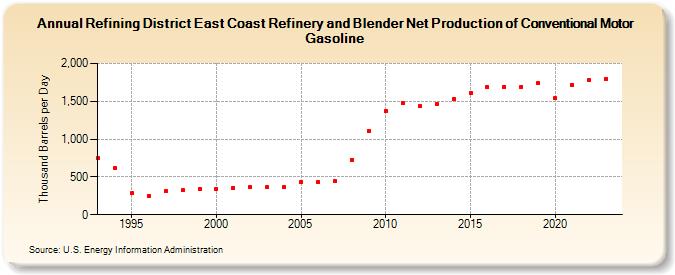
| Refining District East Coast Refinery and Blender Net Production of Conventional Motor Gasoline (Thousand Barrels per Day) | ||||||||
| Decade | Year-0 | Year-1 | Year-2 | Year-3 | Year-4 | Year-5 | Year-6 | Year-7 | Year-8 | Year-9 |
|---|---|---|---|---|---|---|---|---|---|---|
| 1990's | 745 | 624 | 281 | 253 | 311 | 322 | 340 | |||
| 2000's | 336 | 355 | 360 | 363 | 365 | 434 | 438 | 445 | 727 | 1,111 |
| 2010's | 1,369 | 1,479 | 1,433 | 1,469 | 1,527 | 1,611 | 1,686 | 1,691 | 1,693 | 1,738 |
| 2020's | 1,538 | 1,721 | 1,778 | 1,799 |
| - = No Data Reported; -- = Not Applicable; NA = Not Available; W = Withheld to avoid disclosure of individual company data. |
| Release Date: 6/28/2024 |
| Next Release Date: 8/30/2024 |