|
Download Data (XLS File) |
|
||||||||
|
||||||||
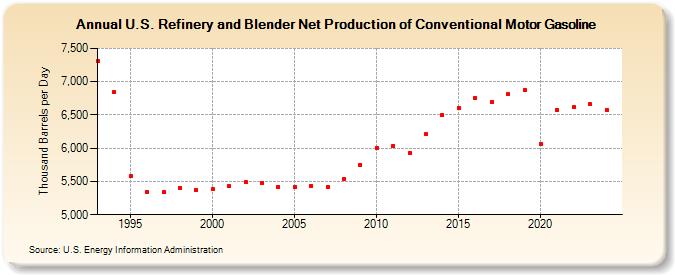
| U.S. Refinery and Blender Net Production of Conventional Motor Gasoline (Thousand Barrels per Day) | ||||||||
| Decade | Year-0 | Year-1 | Year-2 | Year-3 | Year-4 | Year-5 | Year-6 | Year-7 | Year-8 | Year-9 |
|---|---|---|---|---|---|---|---|---|---|---|
| 1990's | 7,304 | 6,841 | 5,575 | 5,344 | 5,336 | 5,409 | 5,370 | |||
| 2000's | 5,384 | 5,425 | 5,492 | 5,480 | 5,422 | 5,419 | 5,435 | 5,416 | 5,543 | 5,754 |
| 2010's | 6,005 | 6,034 | 5,930 | 6,206 | 6,505 | 6,608 | 6,753 | 6,701 | 6,809 | 6,872 |
| 2020's | 6,070 | 6,576 | 6,618 | 6,654 |
| - = No Data Reported; -- = Not Applicable; NA = Not Available; W = Withheld to avoid disclosure of individual company data. |
| Release Date: 6/28/2024 |
| Next Release Date: 8/30/2024 |