|
Download Data (XLS File) |
|
||||||||
|
||||||||
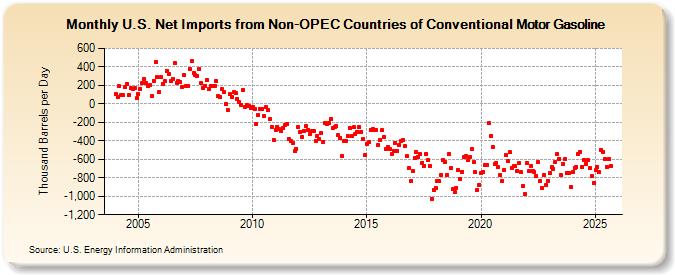
| U.S. Net Imports from Non-OPEC Countries of Conventional Motor Gasoline (Thousand Barrels per Day) | ||||||||
| Year | Jan | Feb | Mar | Apr | May | Jun | Jul | Aug | Sep | Oct | Nov | Dec |
|---|---|---|---|---|---|---|---|---|---|---|---|---|
| 2004 | 102 | 71 | 188 | 96 | 91 | 178 | 215 | 97 | 166 | 165 | 171 | 60 |
| 2005 | 108 | 165 | 223 | 264 | 224 | 188 | 203 | 81 | 250 | 458 | 286 | 132 |
| 2006 | 293 | 219 | 244 | 360 | 323 | 245 | 269 | 441 | 226 | 244 | 236 | 186 |
| 2007 | 311 | 191 | 188 | 377 | 459 | 339 | 309 | 300 | 378 | 221 | 169 | 191 |
| 2008 | 253 | 158 | 190 | 196 | 196 | 246 | 86 | 70 | 159 | 125 | -1 | -66 |
| 2009 | 104 | 78 | 127 | 112 | 57 | 15 | -9 | 153 | -35 | -17 | -28 | -50 |
| 2010 | -31 | -54 | -218 | -126 | -53 | -58 | -134 | -39 | -72 | -168 | -251 | -390 |
| 2011 | -285 | -247 | -273 | -299 | -264 | -225 | -219 | -383 | -405 | -424 | -512 | -487 |
| 2012 | -251 | -300 | -355 | -290 | -240 | -283 | -324 | -297 | -298 | -397 | -350 | -382 |
| 2013 | -319 | -408 | -209 | -214 | -203 | -162 | -266 | -252 | -241 | -342 | -367 | -560 |
| 2014 | -397 | -403 | -346 | -258 | -350 | -256 | -323 | -302 | -253 | -302 | -385 | -558 |
| 2015 | -431 | -412 | -283 | -277 | -288 | -281 | -441 | -391 | -285 | -359 | -487 | -466 |
| 2016 | -489 | -547 | -506 | -421 | -512 | -447 | -405 | -395 | -458 | -567 | -695 | -838 |
| 2017 | -731 | -591 | -526 | -571 | -543 | -635 | -672 | -545 | -609 | -670 | -1,026 | -932 |
| 2018 | -908 | -833 | -839 | -768 | -609 | -630 | -766 | -542 | -698 | -924 | -953 | -908 |
| 2019 | -717 | -816 | -735 | -570 | -563 | -609 | -575 | -486 | -634 | -739 | -932 | -875 |
| 2020 | -752 | -735 | -660 | -665 | -206 | -344 | -464 | -652 | -637 | -689 | -769 | -834 |
| 2021 | -713 | -554 | -622 | -525 | -693 | -677 | -676 | -724 | -639 | -743 | -890 | -979 |
| 2022 | -640 | -731 | -668 | -730 | -737 | -780 | -633 | -836 | -906 | -770 | -883 | -834 |
| 2023 | -776 | -709 | -768 | -581 | -526 | -637 | -734 | -639 | -616 | -744 | -739 | -900 |
| 2024 | -788 | |||||||||||
| - = No Data Reported; -- = Not Applicable; NA = Not Available; W = Withheld to avoid disclosure of individual company data. |
| Release Date: 3/29/2024 |
| Next Release Date: 4/30/2024 |