|
Download Data (XLS File) |
|
||||||||
|
||||||||
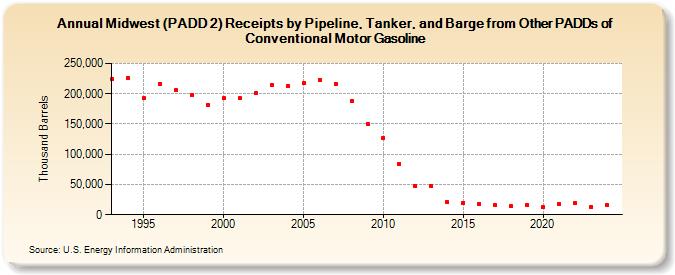
| Midwest (PADD 2) Receipts by Pipeline, Tanker, and Barge from Other PADDs of Conventional Motor Gasoline (Thousand Barrels) | ||||||||
| Decade | Year-0 | Year-1 | Year-2 | Year-3 | Year-4 | Year-5 | Year-6 | Year-7 | Year-8 | Year-9 |
|---|---|---|---|---|---|---|---|---|---|---|
| 1990's | 224,280 | 226,592 | 192,165 | 216,224 | 205,577 | 197,777 | 182,013 | |||
| 2000's | 192,288 | 192,548 | 200,463 | 213,853 | 212,868 | 217,299 | 222,787 | 216,435 | 188,798 | 150,114 |
| 2010's | 126,842 | 83,994 | 47,639 | 46,933 | 20,809 | 19,983 | 17,875 | 15,297 | 14,190 | 15,905 |
| 2020's | 12,474 | 17,370 | 18,665 | 13,294 |
| - = No Data Reported; -- = Not Applicable; NA = Not Available; W = Withheld to avoid disclosure of individual company data. |
| Release Date: 8/30/2024 |
| Next Release Date: 8/29/2025 |