|
Download Data (XLS File) |
|
||||||||
|
||||||||
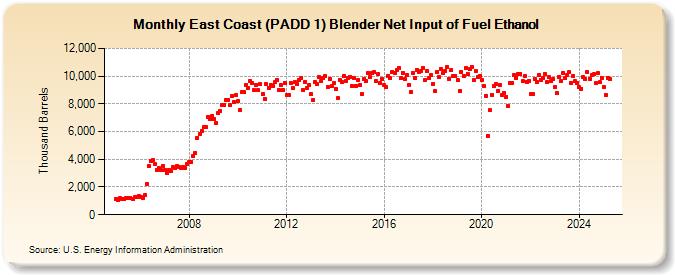
| East Coast (PADD 1) Blender Net Input of Fuel Ethanol (Thousand Barrels) | ||||||||
| Year | Jan | Feb | Mar | Apr | May | Jun | Jul | Aug | Sep | Oct | Nov | Dec |
|---|---|---|---|---|---|---|---|---|---|---|---|---|
| 2005 | 1,119 | 1,038 | 1,192 | 1,142 | 1,143 | 1,191 | 1,210 | 1,211 | 1,163 | 1,247 | 1,260 | 1,349 |
| 2006 | 1,295 | 1,202 | 1,398 | 2,233 | 3,522 | 3,875 | 3,957 | 3,660 | 3,230 | 3,362 | 3,199 | 3,517 |
| 2007 | 3,242 | 3,005 | 3,258 | 3,185 | 3,414 | 3,371 | 3,538 | 3,430 | 3,351 | 3,474 | 3,385 | 3,641 |
| 2008 | 3,780 | 3,809 | 4,229 | 4,467 | 5,560 | 5,817 | 6,072 | 6,345 | 6,313 | 7,054 | 6,937 | 7,123 |
| 2009 | 6,916 | 6,584 | 7,320 | 7,474 | 7,899 | 7,934 | 8,286 | 8,304 | 7,914 | 8,529 | 8,138 | 8,626 |
| 2010 | 8,196 | 7,572 | 8,850 | 8,828 | 9,361 | 9,170 | 9,633 | 9,497 | 8,966 | 9,389 | 8,979 | 9,408 |
| 2011 | 8,709 | 8,357 | 9,407 | 9,173 | 9,393 | 9,292 | 9,554 | 9,717 | 8,994 | 9,351 | 9,008 | 9,515 |
| 2012 | 8,661 | 8,633 | 9,498 | 9,110 | 9,574 | 9,463 | 9,755 | 9,880 | 8,996 | 9,584 | 9,145 | 9,334 |
| 2013 | 8,696 | 8,263 | 9,558 | 9,399 | 9,903 | 9,627 | 9,894 | 9,992 | 9,240 | 9,794 | 9,271 | 9,496 |
| 2014 | 9,063 | 8,385 | 9,719 | 9,589 | 10,037 | 9,643 | 9,899 | 9,952 | 9,307 | 9,866 | 9,297 | 9,754 |
| 2015 | 9,359 | 8,712 | 9,789 | 9,639 | 10,196 | 9,923 | 10,258 | 10,283 | 9,638 | 10,164 | 9,499 | 9,786 |
| 2016 | 9,330 | 9,191 | 10,029 | 9,837 | 10,273 | 10,222 | 10,431 | 10,570 | 9,856 | 10,254 | 9,803 | 10,093 |
| 2017 | 9,371 | 8,872 | 10,240 | 9,851 | 10,462 | 10,262 | 10,393 | 10,595 | 9,726 | 10,337 | 9,867 | 10,094 |
| 2018 | 9,442 | 8,913 | 10,275 | 9,907 | 10,493 | 10,260 | 10,377 | 10,645 | 9,770 | 10,421 | 10,000 | 10,040 |
| 2019 | 9,733 | 8,929 | 10,326 | 10,036 | 10,583 | 10,183 | 10,522 | 10,691 | 9,698 | 10,365 | 9,954 | 10,009 |
| 2020 | 9,715 | 9,278 | 8,597 | 5,703 | 7,519 | 8,658 | 9,267 | 9,420 | 8,954 | 9,344 | 8,644 | 8,811 |
| 2021 | 8,527 | 7,855 | 9,504 | 9,526 | 10,048 | 9,845 | 10,182 | 10,169 | 9,615 | 9,994 | 9,580 | 9,669 |
| 2022 | 8,721 | 8,741 | 9,801 | 9,562 | 10,056 | 9,725 | 9,836 | 10,156 | 9,588 | 9,916 | 9,623 | 9,802 |
| 2023 | 9,200 | 8,757 | 9,948 | 9,669 | 10,243 | 9,816 | 10,065 | 10,285 | 9,544 | 10,043 | 9,621 | 9,515 |
| 2024 | 9,181 | 9,087 | 9,913 | 9,778 | ||||||||
| - = No Data Reported; -- = Not Applicable; NA = Not Available; W = Withheld to avoid disclosure of individual company data. |
| Release Date: 6/28/2024 |
| Next Release Date: 7/31/2024 |
Referring Pages: