|
Download Data (XLS File) |
|
||||||||
|
||||||||
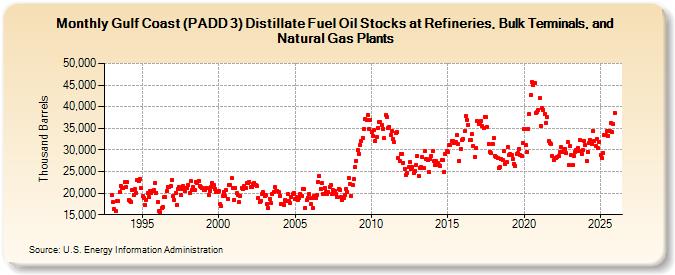
| Gulf Coast (PADD 3) Distillate Fuel Oil Stocks at Refineries, Bulk Terminals, and Natural Gas Plants (Thousand Barrels) | ||||||||
| Year | Jan | Feb | Mar | Apr | May | Jun | Jul | Aug | Sep | Oct | Nov | Dec |
|---|---|---|---|---|---|---|---|---|---|---|---|---|
| 1993 | 19,536 | 17,914 | 16,237 | 15,792 | 18,153 | 18,111 | 20,166 | 21,751 | 21,252 | 21,176 | 22,480 | 21,448 |
| 1994 | 22,531 | 18,379 | 18,202 | 18,024 | 20,698 | 19,657 | 20,882 | 19,989 | 23,060 | 22,893 | 23,251 | 21,135 |
| 1995 | 19,223 | 18,885 | 17,334 | 18,349 | 20,046 | 19,210 | 20,580 | 20,101 | 20,542 | 20,610 | 22,400 | 20,096 |
| 1996 | 18,054 | 15,855 | 15,566 | 16,501 | 16,813 | 19,015 | 19,027 | 20,436 | 21,521 | 21,419 | 21,602 | 23,098 |
| 1997 | 19,295 | 18,425 | 20,086 | 17,280 | 20,969 | 21,369 | 19,578 | 21,015 | 21,530 | 20,448 | 21,073 | 21,185 |
| 1998 | 21,915 | 20,073 | 22,710 | 20,652 | 21,431 | 20,652 | 22,664 | 22,337 | 22,890 | 21,750 | 21,346 | 21,090 |
| 1999 | 20,658 | 20,721 | 21,291 | 21,129 | 19,645 | 20,567 | 21,375 | 22,391 | 21,788 | 20,955 | 20,196 | 20,161 |
| 2000 | 20,584 | 17,415 | 16,930 | 19,305 | 20,372 | 19,301 | 20,711 | 18,629 | 21,836 | 21,894 | 23,489 | 21,195 |
| 2001 | 18,479 | 21,235 | 19,998 | 19,477 | 17,872 | 19,376 | 21,161 | 20,920 | 21,581 | 21,139 | 22,236 | 22,435 |
| 2002 | 22,629 | 21,389 | 21,335 | 22,129 | 22,400 | 21,968 | 21,557 | 18,871 | 17,882 | 18,181 | 19,907 | 20,190 |
| 2003 | 19,266 | 19,450 | 17,456 | 16,658 | 18,642 | 17,721 | 19,834 | 20,311 | 21,510 | 20,572 | 20,586 | 20,157 |
| 2004 | 19,408 | 17,591 | 17,482 | 17,270 | 18,440 | 18,152 | 19,688 | 18,289 | 17,763 | 19,085 | 19,722 | 20,139 |
| 2005 | 18,617 | 19,175 | 18,447 | 18,967 | 19,803 | 19,300 | 21,008 | 20,927 | 16,588 | 18,353 | 18,928 | 19,849 |
| 2006 | 17,400 | 18,839 | 16,533 | 19,289 | 18,876 | 19,451 | 22,611 | 23,991 | 21,033 | 22,319 | 19,707 | 21,247 |
| 2007 | 20,311 | 19,762 | 20,313 | 21,359 | 21,840 | 19,717 | 20,618 | 20,569 | 19,881 | 19,035 | 20,896 | 20,747 |
| 2008 | 19,005 | 18,520 | 18,904 | 19,621 | 21,004 | 20,202 | 23,416 | 22,100 | 19,400 | 21,873 | 23,197 | 25,978 |
| 2009 | 27,526 | 29,969 | 29,153 | 31,081 | 32,106 | 32,851 | 34,848 | 37,157 | 36,894 | 38,050 | 34,779 | 37,024 |
| 2010 | 34,157 | 33,309 | 34,500 | 32,107 | 33,085 | 35,049 | 36,373 | 36,456 | 35,738 | 34,935 | 32,721 | 37,979 |
| 2011 | 37,715 | 35,135 | 35,308 | 33,542 | 34,375 | 32,527 | 31,761 | 33,952 | 34,074 | 28,182 | 27,532 | 29,006 |
| 2012 | 29,133 | 27,026 | 25,647 | 24,291 | 24,650 | 25,978 | 27,156 | 25,534 | 25,964 | 24,661 | 25,066 | 26,598 |
| 2013 | 28,589 | 24,034 | 25,873 | 26,111 | 28,267 | 25,717 | 29,735 | 27,876 | 27,755 | 24,785 | 27,963 | 28,644 |
| 2014 | 29,739 | 27,345 | 26,473 | 27,371 | 26,907 | 26,393 | 26,291 | 27,565 | 27,686 | 24,928 | 29,086 | 29,671 |
| 2015 | 29,584 | 31,024 | 31,094 | 32,120 | 31,964 | 31,525 | 31,942 | 33,475 | 31,437 | 27,525 | 30,109 | 32,292 |
| 2016 | 32,435 | 34,273 | 37,892 | 36,982 | 35,836 | 32,210 | 32,213 | 33,572 | 30,929 | 28,432 | 30,399 | 36,579 |
| 2017 | 36,001 | 36,340 | 36,746 | 35,642 | 35,155 | 37,676 | 37,575 | 35,292 | 31,439 | 29,594 | 29,182 | 31,466 |
| 2018 | 32,848 | 28,646 | 28,385 | 28,098 | 25,768 | 26,020 | 27,926 | 27,722 | 29,643 | 26,822 | 27,167 | 30,618 |
| 2019 | 28,756 | 29,053 | 28,732 | 27,836 | 26,839 | 26,299 | 29,133 | 29,206 | 30,177 | 28,791 | 28,566 | 31,583 |
| 2020 | 34,916 | 31,103 | 29,520 | 34,925 | 38,331 | 42,688 | 45,630 | 45,051 | 45,506 | 38,542 | 38,815 | 39,306 |
| 2021 | 41,941 | 35,584 | 39,669 | 39,345 | 38,408 | 36,281 | 37,511 | 31,997 | 31,514 | 31,289 | 28,606 | 27,581 |
| 2022 | 28,064 | 28,141 | 28,410 | 28,679 | 29,562 | 30,568 | 29,448 | 30,121 | 30,276 | 29,188 | 31,808 | 26,517 |
| 2023 | 30,803 | 28,724 | 26,472 | 28,623 | 29,445 | 29,919 | 30,504 | 29,633 | 32,213 | 29,013 | 29,990 | 32,094 |
| 2024 | 31,172 | 27,262 | 29,421 | 31,437 | 32,227 | 31,091 | ||||||
| - = No Data Reported; -- = Not Applicable; NA = Not Available; W = Withheld to avoid disclosure of individual company data. |
| Release Date: 8/30/2024 |
| Next Release Date: 9/30/2024 |