|
Download Data (XLS File) |
|
||||||||
|
||||||||
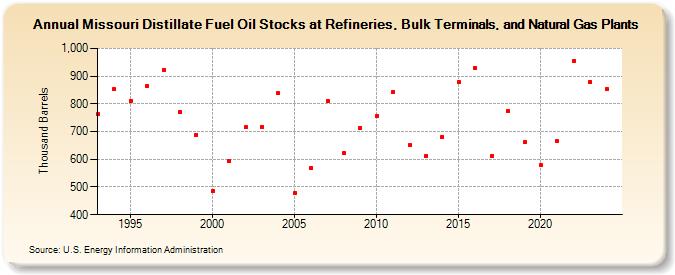
| Missouri Distillate Fuel Oil Stocks at Refineries, Bulk Terminals, and Natural Gas Plants (Thousand Barrels) | ||||||||
| Decade | Year-0 | Year-1 | Year-2 | Year-3 | Year-4 | Year-5 | Year-6 | Year-7 | Year-8 | Year-9 |
|---|---|---|---|---|---|---|---|---|---|---|
| 1990's | 764 | 852 | 812 | 863 | 923 | 771 | 689 | |||
| 2000's | 487 | 594 | 715 | 718 | 838 | 478 | 570 | 811 | 623 | 713 |
| 2010's | 755 | 841 | 652 | 611 | 681 | 877 | 930 | 611 | 775 | 661 |
| 2020's | 579 | 665 | 955 | 880 |
| - = No Data Reported; -- = Not Applicable; NA = Not Available; W = Withheld to avoid disclosure of individual company data. |
| Release Date: 3/29/2024 |
| Next Release Date: 8/30/2024 |