|
Download Data (XLS File) |
|
||||||||
|
||||||||
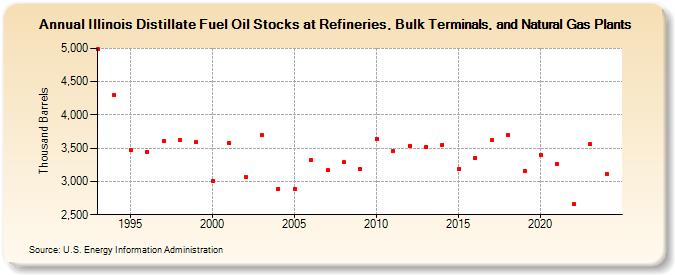
| Illinois Distillate Fuel Oil Stocks at Refineries, Bulk Terminals, and Natural Gas Plants (Thousand Barrels) | ||||||||
| Decade | Year-0 | Year-1 | Year-2 | Year-3 | Year-4 | Year-5 | Year-6 | Year-7 | Year-8 | Year-9 |
|---|---|---|---|---|---|---|---|---|---|---|
| 1990's | 4,987 | 4,305 | 3,475 | 3,444 | 3,602 | 3,628 | 3,589 | |||
| 2000's | 3,010 | 3,585 | 3,067 | 3,697 | 2,887 | 2,892 | 3,323 | 3,171 | 3,288 | 3,185 |
| 2010's | 3,645 | 3,453 | 3,538 | 3,525 | 3,554 | 3,186 | 3,357 | 3,616 | 3,698 | 3,162 |
| 2020's | 3,398 | 3,268 | 2,659 | 3,561 |
| - = No Data Reported; -- = Not Applicable; NA = Not Available; W = Withheld to avoid disclosure of individual company data. |
| Release Date: 8/30/2024 |
| Next Release Date: 8/29/2025 |