|
Download Data (XLS File) |
|
||||||||
|
||||||||
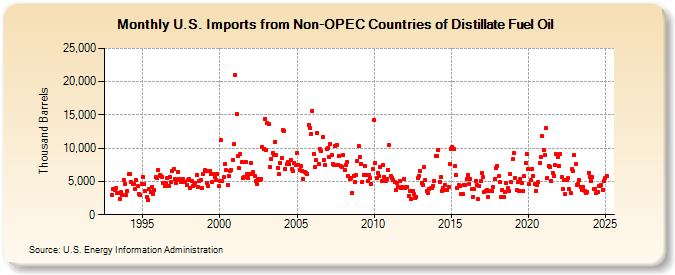
| U.S. Imports from Non-OPEC Countries of Distillate Fuel Oil (Thousand Barrels) | ||||||||
| Year | Jan | Feb | Mar | Apr | May | Jun | Jul | Aug | Sep | Oct | Nov | Dec |
|---|---|---|---|---|---|---|---|---|---|---|---|---|
| 1993 | 3,020 | 3,871 | 3,707 | 4,005 | 3,202 | 3,237 | 2,428 | 3,384 | 2,985 | 5,280 | 4,594 | 2,892 |
| 1994 | 3,564 | 6,069 | 6,092 | 4,990 | 4,563 | 4,592 | 3,838 | 5,160 | 4,245 | 3,136 | 2,903 | 4,656 |
| 1995 | 5,687 | 4,606 | 3,592 | 2,590 | 2,196 | 3,845 | 3,342 | 4,145 | 3,162 | 3,642 | 5,606 | 5,508 |
| 1996 | 6,723 | 5,912 | 5,798 | 5,735 | 4,710 | 4,246 | 4,697 | 5,584 | 4,261 | 5,674 | 4,869 | 6,513 |
| 1997 | 6,844 | 5,367 | 4,798 | 6,488 | 5,330 | 5,277 | 4,933 | 5,363 | 4,917 | 4,983 | 4,410 | 5,222 |
| 1998 | 5,317 | 4,072 | 5,126 | 4,309 | 4,534 | 4,824 | 5,922 | 4,178 | 5,062 | 5,171 | 4,000 | 6,149 |
| 1999 | 6,671 | 6,537 | 4,827 | 4,278 | 6,537 | 6,096 | 4,969 | 6,176 | 5,643 | 5,288 | 6,163 | 4,248 |
| 2000 | 5,039 | 11,214 | 5,027 | 5,602 | 7,632 | 6,650 | 4,492 | 5,778 | 6,587 | 6,769 | 8,287 | 10,615 |
| 2001 | 20,993 | 15,124 | 8,867 | 6,969 | 9,146 | 7,861 | 5,493 | 5,704 | 7,961 | 6,143 | 5,577 | 6,121 |
| 2002 | 7,826 | 6,080 | 6,359 | 5,892 | 5,098 | 4,599 | 5,413 | 5,149 | 5,422 | 10,199 | 9,873 | 14,359 |
| 2003 | 9,785 | 13,799 | 13,709 | 7,172 | 8,424 | 9,249 | 9,045 | 10,975 | 8,950 | 7,015 | 6,061 | 7,740 |
| 2004 | 8,569 | 12,804 | 12,553 | 6,903 | 7,567 | 7,923 | 7,551 | 8,243 | 6,804 | 6,520 | 7,781 | 7,408 |
| 2005 | 9,279 | 7,498 | 6,667 | 7,323 | 6,622 | 5,404 | 6,467 | 6,314 | 6,139 | 13,469 | 13,103 | 12,157 |
| 2006 | 15,590 | 9,179 | 7,143 | 8,211 | 12,353 | 7,560 | 9,868 | 9,604 | 11,649 | 8,216 | 7,527 | 9,824 |
| 2007 | 9,980 | 8,632 | 10,684 | 8,951 | 7,687 | 7,421 | 10,310 | 10,536 | 7,538 | 8,824 | 7,249 | 7,124 |
| 2008 | 8,935 | 6,651 | 7,473 | 7,873 | 5,838 | 5,336 | 5,469 | 3,244 | 5,839 | 4,882 | 5,941 | 8,123 |
| 2009 | 10,307 | 8,696 | 7,607 | 4,964 | 5,997 | 7,315 | 5,933 | 5,087 | 5,907 | 5,496 | 4,626 | 6,810 |
| 2010 | 14,296 | 7,782 | 5,477 | 6,303 | 5,825 | 7,102 | 5,040 | 7,422 | 5,670 | 5,061 | 5,331 | 6,787 |
| 2011 | 10,426 | 5,753 | 5,460 | 5,216 | 4,845 | 3,692 | 4,817 | 4,102 | 5,115 | 3,966 | 4,145 | 5,315 |
| 2012 | 4,085 | 4,118 | 4,233 | 2,789 | 3,498 | 2,290 | 3,617 | 3,076 | 2,458 | 2,713 | 5,454 | 5,880 |
| 2013 | 6,616 | 4,734 | 4,515 | 7,135 | 5,211 | 3,617 | 3,318 | 3,812 | 3,949 | 3,979 | 4,336 | 5,086 |
| 2014 | 8,784 | 8,845 | 9,797 | 4,992 | 5,603 | 3,616 | 3,984 | 4,434 | 3,768 | 3,727 | 4,092 | 7,601 |
| 2015 | 9,942 | 10,219 | 9,867 | 7,294 | 5,936 | 3,970 | 4,423 | 4,336 | 3,088 | 3,128 | 4,509 | 4,491 |
| 2016 | 5,317 | 6,037 | 4,659 | 5,296 | 3,817 | 2,651 | 3,803 | 5,072 | 4,504 | 2,319 | 4,336 | 5,028 |
| 2017 | 6,259 | 5,655 | 3,449 | 3,530 | 3,765 | 2,679 | 3,542 | 3,571 | 3,495 | 4,139 | 5,400 | 7,042 |
| 2018 | 7,397 | 5,774 | 4,867 | 2,732 | 3,772 | 2,701 | 3,354 | 4,721 | 4,012 | 3,528 | 6,048 | 4,855 |
| 2019 | 8,327 | 9,274 | 5,567 | 3,644 | 4,966 | 3,619 | 5,390 | 4,767 | 3,536 | 5,756 | 7,753 | 9,132 |
| 2020 | 6,805 | 4,560 | 5,210 | 6,924 | 5,884 | 4,621 | 3,583 | 4,507 | 4,911 | 7,837 | 8,640 | 11,816 |
| 2021 | 9,707 | 9,023 | 12,965 | 5,554 | 7,392 | 7,108 | 5,101 | 6,274 | 5,834 | 7,426 | 9,117 | 8,664 |
| 2022 | 7,311 | 9,172 | 5,696 | 3,858 | 5,254 | 3,053 | 5,260 | 5,457 | 3,805 | 3,272 | 6,807 | 6,551 |
| 2023 | 8,439 | 7,651 | 4,505 | 4,670 | 5,214 | 4,141 | 3,705 | 4,138 | 3,566 | 3,279 | 3,438 | 6,249 |
| 2024 | 5,702 | 5,102 | 5,596 | 3,835 | ||||||||
| - = No Data Reported; -- = Not Applicable; NA = Not Available; W = Withheld to avoid disclosure of individual company data. |
| Release Date: 6/28/2024 |
| Next Release Date: 7/31/2024 |