|
Download Data (XLS File) |
|
||||||||
|
||||||||
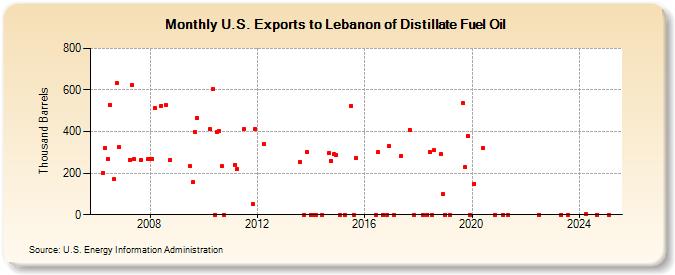
| U.S. Exports to Lebanon of Distillate Fuel Oil (Thousand Barrels) | ||||||||
| Year | Jan | Feb | Mar | Apr | May | Jun | Jul | Aug | Sep | Oct | Nov | Dec |
|---|---|---|---|---|---|---|---|---|---|---|---|---|
| 2006 | 200 | 320 | 268 | 530 | 170 | 634 | 325 | |||||
| 2007 | 265 | 625 | 266 | 265 | 266 | |||||||
| 2008 | 268 | 267 | 514 | 525 | 527 | 265 | ||||||
| 2009 | 232 | 155 | 398 | 466 | ||||||||
| 2010 | 411 | 604 | 0 | 400 | 403 | 232 | 0 | |||||
| 2011 | 241 | 220 | 411 | 50 | 413 | |||||||
| 2012 | 339 | |||||||||||
| 2013 | 253 | 0 | 302 | |||||||||
| 2014 | 0 | 0 | 1 | 0 | 297 | 259 | 291 | 285 | ||||
| 2015 | 0 | 0 | 523 | 0 | 275 | |||||||
| 2016 | 0 | 300 | 0 | 0 | 330 | |||||||
| 2017 | 0 | 281 | 409 | 0 | ||||||||
| 2018 | 0 | 0 | 304 | 0 | 310 | 290 | 98 | |||||
| 2019 | 0 | 0 | 535 | 228 | 378 | 0 | ||||||
| 2020 | 150 | 320 | 0 | |||||||||
| 2021 | 0 | 0 | ||||||||||
| 2022 | 0 | |||||||||||
| 2023 | 1 | 1 | ||||||||||
| 2024 | 2 | |||||||||||
| - = No Data Reported; -- = Not Applicable; NA = Not Available; W = Withheld to avoid disclosure of individual company data. |
| Release Date: 8/30/2024 |
| Next Release Date: 9/30/2024 |