|
Download Data (XLS File) |
|
||||||||
|
||||||||
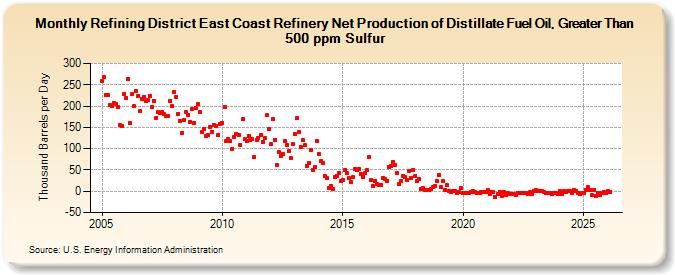
| Refining District East Coast Refinery Net Production of Distillate Fuel Oil, Greater Than 500 ppm Sulfur (Thousand Barrels per Day) | ||||||||
| Year | Jan | Feb | Mar | Apr | May | Jun | Jul | Aug | Sep | Oct | Nov | Dec |
|---|---|---|---|---|---|---|---|---|---|---|---|---|
| 2005 | 259 | 269 | 227 | 225 | 203 | 200 | 208 | 204 | 198 | 156 | 153 | 229 |
| 2006 | 220 | 264 | 160 | 228 | 200 | 235 | 224 | 188 | 217 | 222 | 211 | 214 |
| 2007 | 224 | 198 | 213 | 172 | 186 | 184 | 186 | 181 | 176 | 176 | 212 | 200 |
| 2008 | 233 | 222 | 182 | 166 | 137 | 168 | 185 | 178 | 163 | 193 | 161 | 196 |
| 2009 | 205 | 185 | 140 | 147 | 129 | 132 | 151 | 140 | 155 | 153 | 133 | 159 |
| 2010 | 161 | 198 | 117 | 123 | 118 | 100 | 128 | 135 | 132 | 108 | 169 | 122 |
| 2011 | 117 | 129 | 120 | 122 | 80 | 120 | 126 | 133 | 116 | 125 | 178 | 146 |
| 2012 | 110 | 169 | 121 | 62 | 92 | 83 | 88 | 118 | 109 | 94 | 78 | 110 |
| 2013 | 135 | 171 | 140 | 105 | 120 | 108 | 60 | 66 | 96 | 51 | 57 | 118 |
| 2014 | 88 | 70 | 66 | 35 | 31 | 7 | 13 | 6 | 34 | 37 | 42 | 23 |
| 2015 | 27 | 51 | 42 | 30 | 21 | 34 | 53 | 51 | 52 | 40 | 33 | 42 |
| 2016 | 49 | 80 | 26 | 12 | 25 | 16 | 14 | 15 | 32 | 28 | 25 | 56 |
| 2017 | 59 | 69 | 61 | 44 | 18 | 24 | 37 | 33 | 26 | 48 | 31 | 49 |
| 2018 | 37 | 23 | 28 | 5 | 7 | 4 | 2 | 3 | 5 | 9 | 12 | 24 |
| 2019 | 38 | 9 | 23 | 4 | 14 | 1 | -1 | 1 | 1 | -4 | -2 | 7 |
| 2020 | -4 | -3 | -4 | -3 | -1 | 0 | -2 | -4 | -3 | -1 | -2 | -2 |
| 2021 | 2 | -7 | -2 | -2 | -14 | -7 | -1 | -12 | -1 | -9 | -5 | -7 |
| 2022 | -6 | -6 | -9 | -3 | -4 | -5 | -4 | -5 | -6 | -2 | -6 | 0 |
| 2023 | 3 | 0 | 0 | 0 | -1 | -5 | -3 | -4 | -6 | -3 | -3 | -6 |
| 2024 | 1 | -7 | 0 | -1 | 1 | 0 | ||||||
| - = No Data Reported; -- = Not Applicable; NA = Not Available; W = Withheld to avoid disclosure of individual company data. |
| Release Date: 8/30/2024 |
| Next Release Date: 9/30/2024 |