|
Download Data (XLS File) |
|
||||||||
|
||||||||
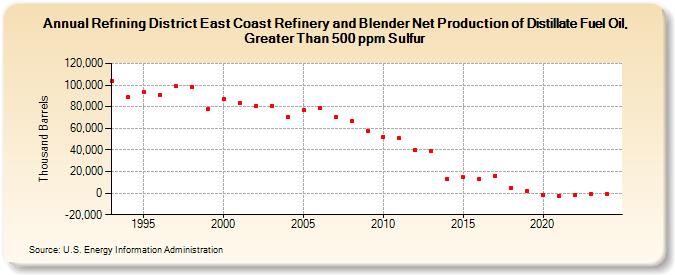
| Refining District East Coast Refinery and Blender Net Production of Distillate Fuel Oil, Greater Than 500 ppm Sulfur (Thousand Barrels) | ||||||||
| Decade | Year-0 | Year-1 | Year-2 | Year-3 | Year-4 | Year-5 | Year-6 | Year-7 | Year-8 | Year-9 |
|---|---|---|---|---|---|---|---|---|---|---|
| 1990's | 104,071 | 88,894 | 93,278 | 91,106 | 99,106 | 98,196 | 77,731 | |||
| 2000's | 86,998 | 83,143 | 80,626 | 80,652 | 70,895 | 76,869 | 78,396 | 70,182 | 66,609 | 57,645 |
| 2010's | 52,285 | 50,702 | 39,741 | 38,714 | 12,737 | 14,629 | 13,348 | 16,095 | 4,659 | 2,362 |
| 2020's | -1,660 | -2,248 | -1,860 | -1,019 |
| - = No Data Reported; -- = Not Applicable; NA = Not Available; W = Withheld to avoid disclosure of individual company data. |
| Release Date: 8/30/2024 |
| Next Release Date: 8/29/2025 |