|
Download Data (XLS File) |
|
||||||||
|
||||||||
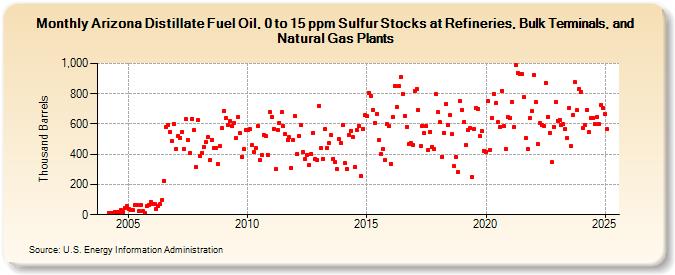
| Arizona Distillate Fuel Oil, 0 to 15 ppm Sulfur Stocks at Refineries, Bulk Terminals, and Natural Gas Plants (Thousand Barrels) | ||||||||
| Year | Jan | Feb | Mar | Apr | May | Jun | Jul | Aug | Sep | Oct | Nov | Dec |
|---|---|---|---|---|---|---|---|---|---|---|---|---|
| 2004 | 14 | 12 | 12 | 20 | 21 | 21 | 31 | 21 | 44 | 55 | ||
| 2005 | 40 | 32 | 33 | 62 | 67 | 23 | 67 | 23 | 14 | 55 | 63 | 86 |
| 2006 | 71 | 70 | 39 | 60 | 69 | 99 | 225 | 581 | 591 | 550 | 486 | 601 |
| 2007 | 436 | 521 | 509 | 547 | 437 | 631 | 491 | 407 | 635 | 562 | 313 | 626 |
| 2008 | 389 | 410 | 446 | 480 | 512 | 365 | 497 | 439 | 440 | 338 | 452 | 572 |
| 2009 | 686 | 641 | 595 | 617 | 584 | 606 | 504 | 645 | 538 | 384 | 434 | 563 |
| 2010 | 557 | 565 | 459 | 413 | 438 | 587 | 364 | 397 | 528 | 522 | 398 | 680 |
| 2011 | 649 | 570 | 303 | 560 | 609 | 677 | 584 | 532 | 497 | 512 | 312 | 496 |
| 2012 | 651 | 401 | 522 | 593 | 415 | 370 | 398 | 332 | 402 | 541 | 368 | 365 |
| 2013 | 722 | 439 | 371 | 565 | 443 | 475 | 525 | 369 | 347 | 299 | 498 | 476 |
| 2014 | 594 | 341 | 304 | 527 | 556 | 514 | 314 | 563 | 585 | 257 | 570 | 657 |
| 2015 | 650 | 807 | 783 | 695 | 609 | 668 | 495 | 403 | 433 | 361 | 597 | 584 |
| 2016 | 338 | 643 | 851 | 715 | 852 | 910 | 799 | 656 | 583 | 465 | 476 | 462 |
| 2017 | 819 | 833 | 692 | 452 | 589 | 538 | 585 | 428 | 548 | 448 | 436 | 796 |
| 2018 | 679 | 610 | 384 | 542 | 734 | 590 | 659 | 532 | 320 | 383 | 282 | 750 |
| 2019 | 695 | 614 | 461 | 557 | 571 | 250 | 568 | 708 | 702 | 520 | 552 | 423 |
| 2020 | 417 | 749 | 429 | 642 | 801 | 738 | 610 | 582 | 820 | 585 | 434 | 646 |
| 2021 | 642 | 746 | 577 | 988 | 938 | 932 | 933 | 778 | 510 | 434 | 638 | 683 |
| 2022 | 925 | 743 | 469 | 606 | 596 | 589 | 872 | 649 | 543 | 347 | 581 | 746 |
| 2023 | 622 | 628 | 594 | 597 | 566 | 508 | 706 | 452 | 661 | 875 | 690 | 830 |
| 2024 | 813 | 575 | 596 | 695 | ||||||||
| - = No Data Reported; -- = Not Applicable; NA = Not Available; W = Withheld to avoid disclosure of individual company data. |
| Release Date: 6/28/2024 |
| Next Release Date: 7/31/2024 |