|
Download Data (XLS File) |
|
||||||||
|
||||||||
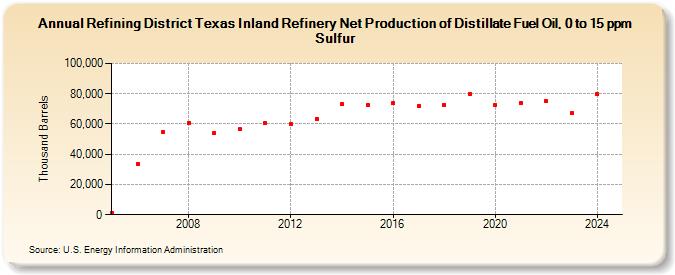
| Refining District Texas Inland Refinery Net Production of Distillate Fuel Oil, 0 to 15 ppm Sulfur (Thousand Barrels) | ||||||||
| Decade | Year-0 | Year-1 | Year-2 | Year-3 | Year-4 | Year-5 | Year-6 | Year-7 | Year-8 | Year-9 |
|---|---|---|---|---|---|---|---|---|---|---|
| 2000's | 1,182 | 33,589 | 54,444 | 60,705 | 53,866 | |||||
| 2010's | 56,422 | 60,339 | 60,273 | 63,503 | 73,320 | 72,660 | 73,607 | 71,999 | 72,778 | 80,111 |
| 2020's | 72,833 | 73,993 | 75,124 | 67,219 |
| - = No Data Reported; -- = Not Applicable; NA = Not Available; W = Withheld to avoid disclosure of individual company data. |
| Release Date: 6/28/2024 |
| Next Release Date: 8/30/2024 |