|
Download Data (XLS File) |
|
||||||||
|
||||||||
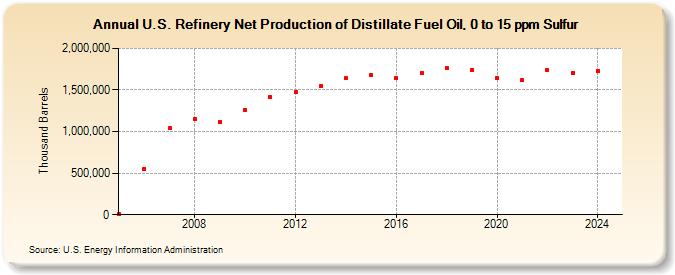
| U.S. Refinery Net Production of Distillate Fuel Oil, 0 to 15 ppm Sulfur (Thousand Barrels) | ||||||||
| Decade | Year-0 | Year-1 | Year-2 | Year-3 | Year-4 | Year-5 | Year-6 | Year-7 | Year-8 | Year-9 |
|---|---|---|---|---|---|---|---|---|---|---|
| 2000's | 8,456 | 555,524 | 1,036,873 | 1,154,946 | 1,114,607 | |||||
| 2010's | 1,258,151 | 1,418,335 | 1,474,307 | 1,546,899 | 1,639,967 | 1,681,208 | 1,642,015 | 1,701,506 | 1,758,886 | 1,739,012 |
| 2020's | 1,645,715 | 1,614,181 | 1,736,252 | 1,706,479 | 1,731,262 |
| - = No Data Reported; -- = Not Applicable; NA = Not Available; W = Withheld to avoid disclosure of individual company data. |
| Release Date: 6/30/2025 |
| Next Release Date: 8/29/2025 |