|
Download Data (XLS File) |
|
||||||||
|
||||||||
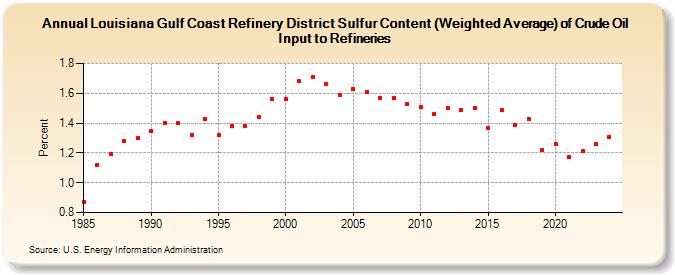
| Louisiana Gulf Coast Refinery District Sulfur Content (Weighted Average) of Crude Oil Input to Refineries (Percent) | ||||||||
| Decade | Year-0 | Year-1 | Year-2 | Year-3 | Year-4 | Year-5 | Year-6 | Year-7 | Year-8 | Year-9 |
|---|---|---|---|---|---|---|---|---|---|---|
| 1980's | 0.87 | 1.12 | 1.19 | 1.28 | 1.30 | |||||
| 1990's | 1.35 | 1.40 | 1.40 | 1.32 | 1.43 | 1.32 | 1.38 | 1.38 | 1.44 | 1.56 |
| 2000's | 1.56 | 1.68 | 1.71 | 1.66 | 1.59 | 1.63 | 1.61 | 1.57 | 1.57 | 1.53 |
| 2010's | 1.51 | 1.46 | 1.50 | 1.49 | 1.50 | 1.37 | 1.49 | 1.39 | 1.43 | 1.22 |
| 2020's | 1.26 | 1.17 | 1.21 | 1.26 |
| - = No Data Reported; -- = Not Applicable; NA = Not Available; W = Withheld to avoid disclosure of individual company data. |
| Release Date: 8/30/2024 |
| Next Release Date: 8/29/2025 |