|
Download Data (XLS File) |
|
||||||||
|
||||||||
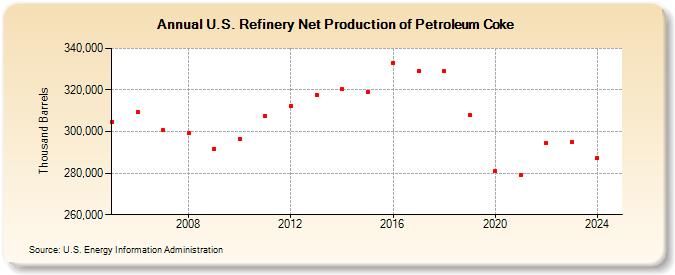
| U.S. Refinery Net Production of Petroleum Coke (Thousand Barrels) | ||||||||
| Decade | Year-0 | Year-1 | Year-2 | Year-3 | Year-4 | Year-5 | Year-6 | Year-7 | Year-8 | Year-9 |
|---|---|---|---|---|---|---|---|---|---|---|
| 2000's | 304,730 | 309,431 | 300,570 | 299,253 | 291,615 | |||||
| 2010's | 296,383 | 307,668 | 312,346 | 317,819 | 320,364 | 318,834 | 333,124 | 329,170 | 328,965 | 308,044 |
| 2020's | 280,816 | 279,119 | 294,585 | 294,322 |
| - = No Data Reported; -- = Not Applicable; NA = Not Available; W = Withheld to avoid disclosure of individual company data. |
| Release Date: 6/28/2024 |
| Next Release Date: 8/30/2024 |
Referring Pages: