|
Download Data (XLS File) |
|
||||||||
|
||||||||
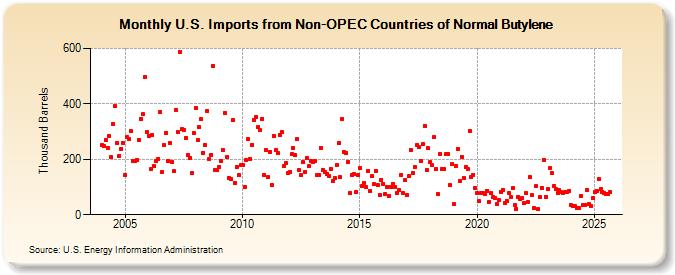
| U.S. Imports from Non-OPEC Countries of Normal Butylene (Thousand Barrels) | ||||||||
| Year | Jan | Feb | Mar | Apr | May | Jun | Jul | Aug | Sep | Oct | Nov | Dec |
|---|---|---|---|---|---|---|---|---|---|---|---|---|
| 2004 | 252 | 247 | 271 | 241 | 285 | 207 | 327 | 391 | 259 | 212 | 238 | 259 |
| 2005 | 145 | 279 | 272 | 301 | 195 | 195 | 199 | 269 | 346 | 362 | 496 | 297 |
| 2006 | 285 | 164 | 286 | 174 | 194 | 201 | 371 | 153 | 252 | 295 | 195 | 257 |
| 2007 | 191 | 156 | 378 | 299 | 588 | 309 | 307 | 278 | 216 | 206 | 151 | 295 |
| 2008 | 385 | 268 | 315 | 344 | 224 | 251 | 375 | 200 | 217 | 537 | 161 | 163 |
| 2009 | 171 | 192 | 234 | 368 | 209 | 133 | 128 | 341 | 116 | 173 | 142 | 178 |
| 2010 | 180 | 101 | 197 | 272 | 202 | 253 | 343 | 353 | 316 | 304 | 347 | 144 |
| 2011 | 235 | 136 | 228 | 108 | 284 | 233 | 222 | 288 | 297 | 174 | 186 | 151 |
| 2012 | 154 | 219 | 240 | 215 | 274 | 161 | 142 | 189 | 153 | 205 | 174 | 195 |
| 2013 | 190 | 193 | 142 | 143 | 241 | 162 | 153 | 146 | 139 | 166 | 121 | 131 |
| 2014 | 179 | 259 | 135 | 345 | 228 | 223 | 190 | 79 | 145 | 147 | 82 | 143 |
| 2015 | 168 | 103 | 116 | 101 | 158 | 85 | 138 | 110 | 159 | 108 | 72 | 127 |
| 2016 | 112 | 73 | 100 | 69 | 100 | 111 | 101 | 78 | 88 | 144 | 78 | 127 |
| 2017 | 71 | 138 | 235 | 151 | 173 | 252 | 245 | 194 | 254 | 321 | 160 | 239 |
| 2018 | 190 | 178 | 280 | 165 | 74 | 220 | 165 | 165 | 218 | 220 | 107 | 182 |
| 2019 | 37 | 176 | 237 | 120 | 210 | 134 | 172 | 166 | 303 | 135 | 145 | 96 |
| 2020 | 79 | 48 | 79 | 77 | 73 | 87 | 46 | 77 | 63 | 61 | 39 | 52 |
| 2021 | 81 | 89 | 41 | 51 | 77 | 64 | 96 | 34 | 22 | 63 | 57 | 59 |
| 2022 | 41 | 78 | 45 | 135 | 70 | 23 | 102 | 19 | 63 | 97 | 199 | 65 |
| 2023 | 40 | 168 | 152 | 103 | 94 | 78 | 89 | 81 | 78 | 81 | 81 | 87 |
| 2024 | 34 | 35 | 30 | 23 | ||||||||
| - = No Data Reported; -- = Not Applicable; NA = Not Available; W = Withheld to avoid disclosure of individual company data. |
| Release Date: 6/28/2024 |
| Next Release Date: 7/31/2024 |