|
Download Data (XLS File) |
|
||||||||
|
||||||||
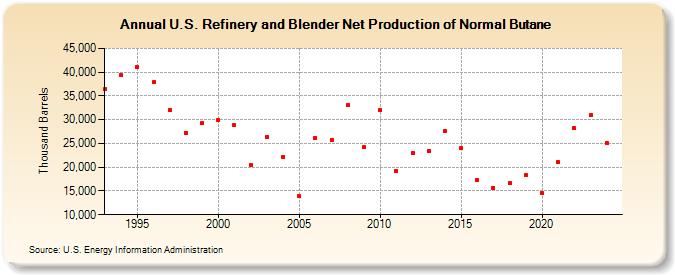
| U.S. Refinery and Blender Net Production of Normal Butane (Thousand Barrels) | ||||||||
| Decade | Year-0 | Year-1 | Year-2 | Year-3 | Year-4 | Year-5 | Year-6 | Year-7 | Year-8 | Year-9 |
|---|---|---|---|---|---|---|---|---|---|---|
| 1990's | 36,429 | 39,336 | 41,083 | 37,843 | 31,985 | 27,277 | 29,236 | |||
| 2000's | 29,838 | 28,819 | 20,387 | 26,352 | 22,188 | 13,838 | 26,098 | 25,715 | 33,092 | 25,825 |
| 2010's | 32,094 | 19,263 | 22,965 | 23,452 | 27,653 | 23,935 | 17,394 | 15,710 | 16,631 | 18,278 |
| 2020's | 14,604 | 21,052 | 28,182 | 30,808 |
| - = No Data Reported; -- = Not Applicable; NA = Not Available; W = Withheld to avoid disclosure of individual company data. |
| Release Date: 6/28/2024 |
| Next Release Date: 8/30/2024 |