|
Download Data (XLS File) |
|
||||||||
|
||||||||
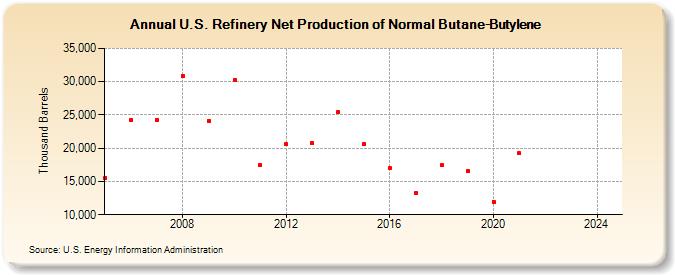
| U.S. Refinery Net Production of Normal Butane-Butylene (Thousand Barrels) | ||||||||
| Decade | Year-0 | Year-1 | Year-2 | Year-3 | Year-4 | Year-5 | Year-6 | Year-7 | Year-8 | Year-9 |
|---|---|---|---|---|---|---|---|---|---|---|
| 2000's | 15,589 | 24,307 | 24,285 | 30,887 | 24,148 | |||||
| 2010's | 30,281 | 17,449 | 20,580 | 20,737 | 25,412 | 20,590 | 16,959 | 13,313 | 17,433 | 16,551 |
| 2020's | 11,969 | 19,220 | -- | -- |
| - = No Data Reported; -- = Not Applicable; NA = Not Available; W = Withheld to avoid disclosure of individual company data. |
| Release Date: 6/28/2024 |
| Next Release Date: 8/30/2024 |