|
Download Data (XLS File) |
|
||||||||
|
||||||||
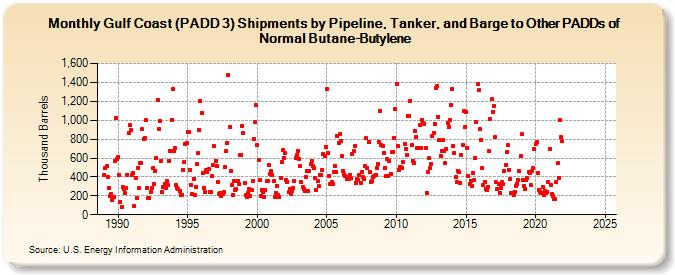
| Gulf Coast (PADD 3) Shipments by Pipeline, Tanker, and Barge to Other PADDs of Normal Butane-Butylene (Thousand Barrels) | ||||||||
| Year | Jan | Feb | Mar | Apr | May | Jun | Jul | Aug | Sep | Oct | Nov | Dec |
|---|---|---|---|---|---|---|---|---|---|---|---|---|
| 1989 | 424 | 494 | 517 | 403 | 282 | 201 | 216 | 155 | 192 | 568 | 1,018 | 589 |
| 1990 | 608 | 423 | 132 | 85 | 291 | 275 | 227 | 278 | 424 | 868 | 944 | 892 |
| 1991 | 417 | 437 | 92 | 393 | 180 | 497 | 278 | 544 | 546 | 903 | 799 | 813 |
| 1992 | 999 | 282 | 178 | 174 | 245 | 281 | 489 | 324 | 459 | 595 | 1,214 | 911 |
| 1993 | 994 | 572 | 241 | 291 | 330 | 285 | 353 | 317 | 564 | 674 | 1,007 | 1,330 |
| 1994 | 675 | 701 | 318 | 286 | 274 | 247 | 212 | 212 | 477 | 561 | 743 | 759 |
| 1995 | 875 | 874 | 475 | 315 | 219 | 382 | 210 | 297 | 534 | 652 | 896 | 1,205 |
| 1996 | 1,079 | 446 | 285 | 243 | 469 | 447 | 483 | 236 | 237 | 406 | 531 | 723 |
| 1997 | 573 | 517 | 348 | 215 | 229 | 199 | 223 | 237 | 505 | 675 | 758 | 1,477 |
| 1998 | 928 | 460 | 318 | 213 | 359 | 259 | 267 | 353 | 326 | 634 | 635 | 940 |
| 1999 | 867 | 331 | 207 | 184 | 225 | 275 | 196 | 263 | 354 | 804 | 984 | 1,158 |
| 2000 | 738 | 575 | 364 | 203 | 264 | 237 | 186 | 262 | 356 | 357 | 529 | 436 |
| 2001 | 466 | 420 | 352 | 184 | 228 | 307 | 211 | 183 | 391 | 562 | 682 | 598 |
| 2002 | 650 | 364 | 347 | 237 | 269 | 221 | 252 | 279 | 353 | 605 | 629 | 679 |
| 2003 | 594 | 514 | 341 | 293 | 271 | 252 | 403 | 458 | 253 | 465 | 538 | 568 |
| 2004 | 513 | 491 | 386 | 259 | 356 | 299 | 415 | 423 | 472 | 639 | 619 | 718 |
| 2005 | 1,327 | 654 | 412 | 329 | 341 | 328 | 455 | 517 | 456 | 835 | 761 | 855 |
| 2006 | 783 | 618 | 466 | 427 | 410 | 373 | 397 | 378 | 423 | 388 | 647 | 676 |
| 2007 | 724 | 332 | 373 | 369 | 425 | 333 | 452 | 401 | 377 | 518 | 811 | 495 |
| 2008 | 767 | 454 | 350 | 353 | 396 | 407 | 425 | 492 | 535 | 768 | 1,100 | 742 |
| 2009 | 729 | 658 | 493 | 408 | 590 | 413 | 569 | 436 | 659 | 668 | 814 | 1,120 |
| 2010 | 1,380 | 728 | 472 | 502 | 500 | 495 | 555 | 747 | 700 | 635 | 1,042 | 1,045 |
| 2011 | 1,205 | 733 | 573 | 544 | 887 | 824 | 710 | 708 | 951 | 704 | 1,004 | 974 |
| 2012 | 961 | 711 | 235 | 450 | 599 | 495 | 541 | 837 | 866 | 964 | 1,344 | 1,362 |
| 2013 | 1,038 | 787 | 624 | 679 | 787 | 677 | 545 | 697 | 974 | 925 | 1,004 | 1,161 |
| 2014 | 1,329 | 729 | 652 | 396 | 347 | 464 | 451 | 335 | 636 | 735 | 1,093 | 923 |
| 2015 | 1,083 | 711 | 408 | 327 | 359 | 304 | 442 | 369 | 602 | 976 | 1,379 | 1,316 |
| 2016 | 905 | 795 | 496 | 313 | 349 | 267 | 261 | 298 | 669 | 1,010 | 1,219 | 1,084 |
| 2017 | 1,147 | 821 | 347 | 271 | 322 | 235 | 281 | 344 | 323 | 462 | 524 | 660 |
| 2018 | 736 | 476 | 375 | 230 | 233 | 207 | 245 | 300 | 325 | 372 | 458 | 618 |
| 2019 | 849 | 368 | 308 | 276 | 366 | 386 | 451 | 445 | 315 | 467 | 495 | 698 |
| 2020 | 749 | 772 | 437 | 259 | 243 | 231 | 293 | 208 | 256 | 225 | 244 | 347 |
| 2021 | 692 | 315 | 214 | 201 | 161 | 166 | 344 | 543 | 392 | 1,007 | 820 | 776 |
| 2022 | -- | -- | -- | -- | -- | -- | -- | -- | -- | -- | -- | -- |
| 2023 | -- | -- | -- | -- | -- | -- | -- | -- | -- | -- | -- | -- |
| 2024 | -- | -- | -- | -- | -- | -- | -- | -- | -- | -- | -- | -- |
| 2025 | -- | -- | -- | -- | ||||||||
| - = No Data Reported; -- = Not Applicable; NA = Not Available; W = Withheld to avoid disclosure of individual company data. |
| Release Date: 6/30/2025 |
| Next Release Date: 7/31/2025 |
Referring Pages: