|
Download Data (XLS File) |
|
||||||||
|
||||||||
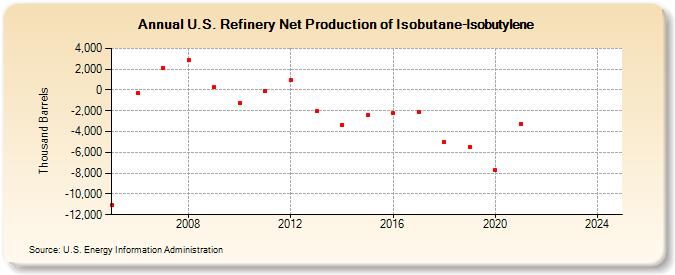
| U.S. Refinery Net Production of Isobutane-Isobutylene (Thousand Barrels) | ||||||||
| Decade | Year-0 | Year-1 | Year-2 | Year-3 | Year-4 | Year-5 | Year-6 | Year-7 | Year-8 | Year-9 |
|---|---|---|---|---|---|---|---|---|---|---|
| 2000's | -11,081 | -312 | 2,117 | 2,853 | 242 | |||||
| 2010's | -1,278 | -97 | 927 | -2,052 | -3,343 | -2,433 | -2,245 | -2,076 | -5,027 | -5,450 |
| 2020's | -7,679 | -3,247 | -- | -- |
| - = No Data Reported; -- = Not Applicable; NA = Not Available; W = Withheld to avoid disclosure of individual company data. |
| Release Date: 6/28/2024 |
| Next Release Date: 8/30/2024 |