|
Download Data (XLS File) |
|
||||||||
|
||||||||
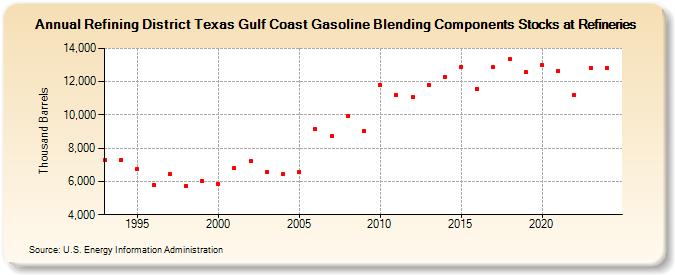
| Refining District Texas Gulf Coast Gasoline Blending Components Stocks at Refineries (Thousand Barrels) | ||||||||
| Decade | Year-0 | Year-1 | Year-2 | Year-3 | Year-4 | Year-5 | Year-6 | Year-7 | Year-8 | Year-9 |
|---|---|---|---|---|---|---|---|---|---|---|
| 1990's | 7,285 | 7,314 | 6,732 | 5,797 | 6,435 | 5,749 | 6,023 | |||
| 2000's | 5,869 | 6,794 | 7,201 | 6,577 | 6,424 | 6,573 | 9,132 | 8,743 | 9,953 | 9,034 |
| 2010's | 11,816 | 11,205 | 11,068 | 11,828 | 12,295 | 12,895 | 11,575 | 12,863 | 13,377 | 12,594 |
| 2020's | 13,019 | 12,667 | 11,195 | 12,847 |
| - = No Data Reported; -- = Not Applicable; NA = Not Available; W = Withheld to avoid disclosure of individual company data. |
| Release Date: 3/29/2024 |
| Next Release Date: 8/30/2024 |