|
Download Data (XLS File) |
|
||||||||
|
||||||||
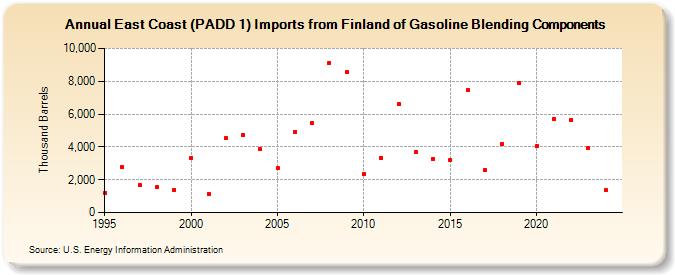
| East Coast (PADD 1) Imports from Finland of Gasoline Blending Components (Thousand Barrels) | ||||||||
| Decade | Year-0 | Year-1 | Year-2 | Year-3 | Year-4 | Year-5 | Year-6 | Year-7 | Year-8 | Year-9 |
|---|---|---|---|---|---|---|---|---|---|---|
| 1990's | 1,210 | 2,775 | 1,682 | 1,548 | 1,404 | |||||
| 2000's | 3,343 | 1,135 | 4,549 | 4,713 | 3,856 | 2,723 | 4,913 | 5,429 | 9,125 | 8,532 |
| 2010's | 2,337 | 3,314 | 6,594 | 3,686 | 3,285 | 3,212 | 7,464 | 2,592 | 4,194 | 7,879 |
| 2020's | 4,053 | 5,695 | 5,667 | 3,931 |
| - = No Data Reported; -- = Not Applicable; NA = Not Available; W = Withheld to avoid disclosure of individual company data. |
| Release Date: 6/28/2024 |
| Next Release Date: 8/30/2024 |