|
Download Data (XLS File) |
|
||||||||
|
||||||||
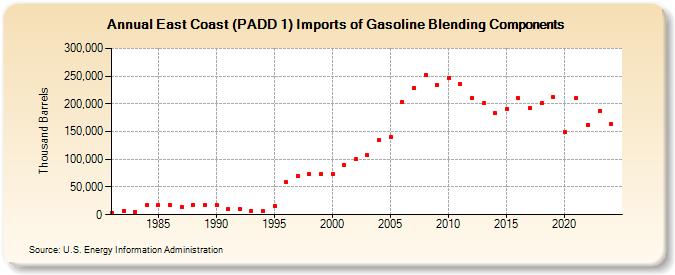
| East Coast (PADD 1) Imports of Gasoline Blending Components (Thousand Barrels) | ||||||||
| Decade | Year-0 | Year-1 | Year-2 | Year-3 | Year-4 | Year-5 | Year-6 | Year-7 | Year-8 | Year-9 |
|---|---|---|---|---|---|---|---|---|---|---|
| 1980's | 2,990 | 7,498 | 5,115 | 16,907 | 17,513 | 17,115 | 14,332 | 17,923 | 17,723 | |
| 1990's | 17,996 | 10,118 | 10,431 | 7,343 | 6,227 | 15,382 | 58,151 | 70,342 | 72,608 | 73,004 |
| 2000's | 72,661 | 90,517 | 99,657 | 107,392 | 134,521 | 140,233 | 203,499 | 228,978 | 252,721 | 234,043 |
| 2010's | 247,221 | 235,527 | 210,841 | 200,952 | 183,039 | 191,007 | 209,743 | 192,049 | 200,780 | 211,995 |
| 2020's | 148,591 | 210,443 | 162,287 | 186,527 |
| - = No Data Reported; -- = Not Applicable; NA = Not Available; W = Withheld to avoid disclosure of individual company data. |
| Release Date: 6/28/2024 |
| Next Release Date: 8/30/2024 |