|
Download Data (XLS File) |
|
||||||||
|
||||||||
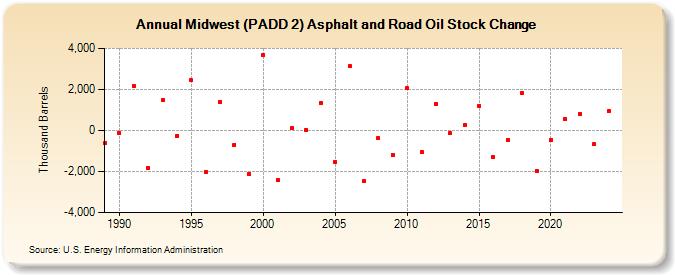
| Midwest (PADD 2) Asphalt and Road Oil Stock Change (Thousand Barrels) | ||||||||
| Decade | Year-0 | Year-1 | Year-2 | Year-3 | Year-4 | Year-5 | Year-6 | Year-7 | Year-8 | Year-9 |
|---|---|---|---|---|---|---|---|---|---|---|
| 1980's | -628 | |||||||||
| 1990's | -132 | 2,185 | -1,808 | 1,497 | -254 | 2,443 | -2,001 | 1,407 | -689 | -2,103 |
| 2000's | 3,678 | -2,423 | 111 | 24 | 1,350 | -1,515 | 3,123 | -2,486 | -356 | -1,171 |
| 2010's | 2,052 | -1,045 | 1,303 | -127 | 250 | 1,211 | -1,296 | -472 | 1,835 | -1,965 |
| 2020's | -460 | 568 | 823 | -677 | 947 |
| - = No Data Reported; -- = Not Applicable; NA = Not Available; W = Withheld to avoid disclosure of individual company data. |
| Release Date: 6/30/2025 |
| Next Release Date: 8/29/2025 |