|
Download Data (XLS File) |
|
||||||||
|
||||||||
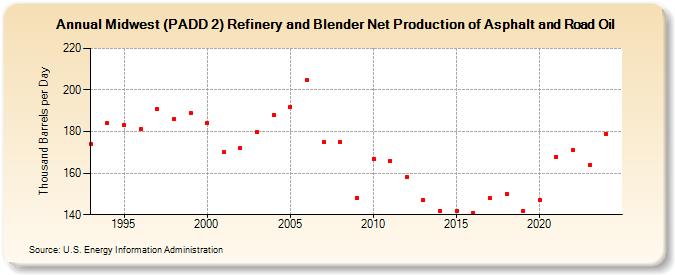
| Midwest (PADD 2) Refinery and Blender Net Production of Asphalt and Road Oil (Thousand Barrels per Day) | ||||||||
| Decade | Year-0 | Year-1 | Year-2 | Year-3 | Year-4 | Year-5 | Year-6 | Year-7 | Year-8 | Year-9 |
|---|---|---|---|---|---|---|---|---|---|---|
| 1990's | 174 | 184 | 183 | 181 | 191 | 186 | 189 | |||
| 2000's | 184 | 170 | 172 | 180 | 188 | 192 | 205 | 175 | 175 | 148 |
| 2010's | 167 | 166 | 158 | 147 | 142 | 142 | 141 | 148 | 150 | 142 |
| 2020's | 147 | 168 | 171 | 164 |
| - = No Data Reported; -- = Not Applicable; NA = Not Available; W = Withheld to avoid disclosure of individual company data. |
| Release Date: 3/29/2024 |
| Next Release Date: 8/30/2024 |