|
Download Data (XLS File) |
|
||||||||
|
||||||||
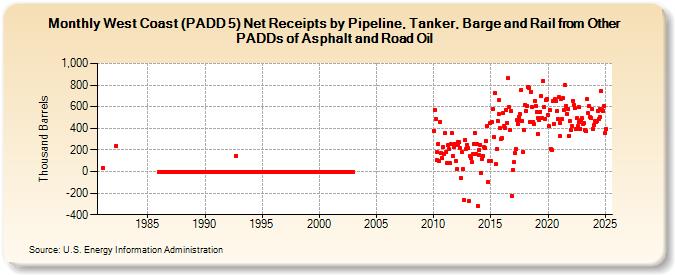
| West Coast (PADD 5) Net Receipts by Pipeline, Tanker, Barge and Rail from Other PADDs of Asphalt and Road Oil (Thousand Barrels) | ||||||||
| Year | Jan | Feb | Mar | Apr | May | Jun | Jul | Aug | Sep | Oct | Nov | Dec |
|---|---|---|---|---|---|---|---|---|---|---|---|---|
| 1981 | 37 | |||||||||||
| 1982 | 238 | |||||||||||
| 1986 | 0 | 0 | 0 | 0 | 0 | 0 | 0 | 0 | 0 | 0 | 0 | 0 |
| 1987 | 0 | 0 | 0 | 0 | 0 | 0 | 0 | 0 | 0 | 0 | 0 | 0 |
| 1988 | 0 | 0 | 0 | 0 | 0 | 0 | 0 | 0 | 0 | 0 | 0 | 0 |
| 1989 | 0 | 0 | 0 | 0 | 0 | 0 | 0 | 0 | 0 | 0 | 0 | 0 |
| 1990 | 0 | 0 | 0 | 0 | 0 | 0 | 0 | 0 | 0 | 0 | 0 | 0 |
| 1991 | 0 | 0 | 0 | 0 | 0 | 0 | 0 | 0 | 0 | 0 | 0 | 0 |
| 1992 | 0 | 0 | 0 | 0 | 0 | 0 | 0 | 0 | 0 | 146 | 0 | 0 |
| 1993 | 0 | 0 | 0 | 0 | 0 | 0 | 0 | 0 | 0 | 0 | 0 | 0 |
| 1994 | 0 | 0 | 0 | 0 | 0 | 0 | 0 | 0 | 0 | 0 | 0 | 0 |
| 1995 | 0 | 0 | 0 | 0 | 0 | 0 | 0 | 0 | 0 | 0 | 0 | 0 |
| 1996 | 0 | 0 | 0 | 0 | 0 | 0 | 0 | 0 | 0 | 0 | 0 | 0 |
| 1997 | 0 | 0 | 0 | 0 | 0 | 0 | 0 | 0 | 0 | 0 | 0 | 0 |
| 1998 | 0 | 0 | 0 | 0 | 0 | 0 | 0 | 0 | 0 | 0 | 0 | 0 |
| 1999 | 0 | 0 | 0 | 0 | 0 | 0 | 0 | 0 | 0 | 0 | 0 | 0 |
| 2000 | 0 | 0 | 0 | 0 | 0 | 0 | 0 | 0 | 0 | 0 | 0 | 0 |
| 2001 | 0 | 0 | 0 | 0 | 0 | 0 | 0 | 0 | 0 | 0 | 0 | 0 |
| 2002 | 0 | 0 | 0 | 0 | 0 | 0 | 0 | 0 | 0 | 0 | 0 | 0 |
| 2010 | 379 | 571 | 485 | 102 | 176 | 258 | 100 | 460 | 167 | 121 | 223 | 162 |
| 2011 | 353 | 181 | 82 | 241 | 207 | 79 | 250 | 354 | 145 | 231 | 257 | 100 |
| 2012 | 22 | 273 | 248 | 269 | 215 | -61 | 178 | 19 | -262 | 294 | 210 | 248 |
| 2013 | 217 | -269 | 140 | 128 | 86 | 160 | 259 | 360 | 160 | 256 | -316 | 149 |
| 2014 | 198 | 249 | -13 | 117 | 146 | 223 | 221 | 281 | 421 | -98 | 101 | 446 |
| 2015 | 100 | 455 | 578 | 321 | 726 | 66 | 209 | 470 | 534 | 659 | 400 | 301 |
| 2016 | 309 | 546 | 421 | 406 | 570 | 452 | 863 | 593 | 381 | 561 | -228 | 17 |
| 2017 | 85 | 170 | 210 | 475 | 443 | 509 | 479 | 532 | 759 | 470 | 180 | 384 |
| 2018 | 619 | 560 | 608 | 786 | 776 | 460 | 739 | 596 | 455 | 439 | 651 | 609 |
| 2019 | 553 | 351 | 497 | 473 | 555 | 696 | 498 | 840 | 597 | 489 | 665 | 667 |
| 2020 | 525 | 420 | 566 | 210 | 198 | 651 | 441 | 668 | 653 | 561 | 482 | 688 |
| 2021 | 325 | 445 | 675 | 488 | 679 | 565 | 799 | 608 | 531 | 582 | 332 | 467 |
| 2022 | 383 | 423 | 656 | 618 | 584 | 392 | 495 | 418 | 457 | 594 | 398 | 479 |
| 2023 | 491 | 442 | 448 | 383 | 371 | 668 | 539 | 604 | 506 | 499 | 582 | 395 |
| 2024 | 428 | 466 | 462 | 464 | ||||||||
| - = No Data Reported; -- = Not Applicable; NA = Not Available; W = Withheld to avoid disclosure of individual company data. |
| Release Date: 6/28/2024 |
| Next Release Date: 7/31/2024 |