|
Download Data (XLS File) |
|
||||||||
|
||||||||
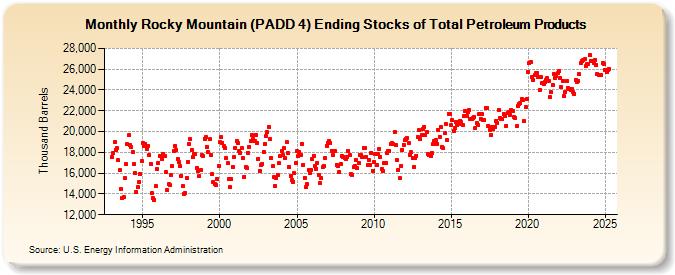
| Rocky Mountain (PADD 4) Ending Stocks of Total Petroleum Products (Thousand Barrels) | ||||||||
| Year | Jan | Feb | Mar | Apr | May | Jun | Jul | Aug | Sep | Oct | Nov | Dec |
|---|---|---|---|---|---|---|---|---|---|---|---|---|
| 1993 | 17,534 | 17,904 | 18,948 | 18,214 | 18,385 | 17,236 | 16,296 | 14,467 | 13,627 | 13,676 | 15,491 | 16,841 |
| 1994 | 18,785 | 19,629 | 18,662 | 18,540 | 18,028 | 16,839 | 15,985 | 14,207 | 14,636 | 15,144 | 15,951 | 17,185 |
| 1995 | 18,919 | 18,629 | 18,806 | 18,361 | 18,626 | 17,722 | 16,897 | 14,058 | 13,598 | 13,443 | 14,757 | 16,353 |
| 1996 | 16,996 | 17,649 | 17,677 | 17,380 | 17,882 | 17,607 | 16,066 | 14,330 | 14,925 | 14,824 | 15,811 | 16,705 |
| 1997 | 18,121 | 18,599 | 18,254 | 17,400 | 17,028 | 16,660 | 15,727 | 14,736 | 14,031 | 14,091 | 15,547 | 17,079 |
| 1998 | 18,844 | 19,237 | 18,213 | 17,514 | 17,856 | 17,814 | 16,499 | 16,232 | 15,744 | 16,287 | 17,739 | 17,657 |
| 1999 | 19,308 | 19,474 | 18,542 | 17,993 | 19,258 | 17,752 | 15,916 | 15,156 | 14,947 | 14,863 | 15,456 | 16,724 |
| 2000 | 18,961 | 19,466 | 18,895 | 18,607 | 18,413 | 17,480 | 16,939 | 15,410 | 14,646 | 15,399 | 16,623 | 17,550 |
| 2001 | 18,452 | 19,111 | 18,883 | 18,111 | 17,981 | 18,416 | 17,442 | 15,659 | 16,577 | 16,529 | 17,975 | 18,514 |
| 2002 | 19,108 | 19,633 | 19,244 | 19,080 | 19,702 | 18,933 | 17,357 | 16,218 | 16,768 | 16,892 | 18,066 | 18,801 |
| 2003 | 19,574 | 19,915 | 20,468 | 19,250 | 17,471 | 16,660 | 15,591 | 14,773 | 15,546 | 15,813 | 16,945 | 17,616 |
| 2004 | 18,083 | 17,740 | 18,421 | 17,427 | 18,986 | 17,961 | 16,603 | 15,690 | 15,307 | 15,176 | 15,974 | 16,947 |
| 2005 | 18,082 | 17,621 | 18,038 | 17,726 | 18,827 | 16,810 | 15,572 | 14,639 | 14,915 | 16,291 | 15,967 | 16,323 |
| 2006 | 17,393 | 17,674 | 16,704 | 16,429 | 16,954 | 15,803 | 15,007 | 15,509 | 16,606 | 16,669 | 17,434 | 18,610 |
| 2007 | 18,903 | 19,073 | 18,887 | 18,167 | 17,758 | 18,145 | 18,124 | 16,813 | 16,654 | 16,112 | 16,882 | 17,648 |
| 2008 | 17,583 | 17,501 | 17,385 | 17,525 | 18,164 | 17,716 | 15,932 | 15,845 | 16,562 | 16,733 | 17,306 | 16,463 |
| 2009 | 16,932 | 17,739 | 17,717 | 17,531 | 18,370 | 18,447 | 17,572 | 16,738 | 17,287 | 16,816 | 17,971 | 16,229 |
| 2010 | 17,081 | 17,821 | 16,742 | 17,869 | 18,335 | 17,586 | 16,434 | 16,215 | 17,011 | 16,957 | 17,932 | 18,155 |
| 2011 | 18,132 | 18,786 | 18,876 | 18,770 | 19,935 | 18,709 | 17,299 | 16,329 | 15,516 | 16,706 | 18,268 | 18,744 |
| 2012 | 19,168 | 19,274 | 19,356 | 18,912 | 17,779 | 18,004 | 17,447 | 16,608 | 17,457 | 17,693 | 19,461 | 20,115 |
| 2013 | 19,268 | 19,657 | 20,280 | 20,472 | 19,660 | 19,962 | 17,825 | 17,708 | 17,615 | 17,902 | 18,766 | 19,053 |
| 2014 | 19,159 | 18,846 | 20,162 | 19,517 | 20,449 | 18,504 | 18,378 | 19,822 | 20,704 | 19,216 | 21,713 | 21,695 |
| 2015 | 20,600 | 21,094 | 20,056 | 20,346 | 20,946 | 20,666 | 20,710 | 21,051 | 20,884 | 20,588 | 21,532 | 21,997 |
| 2016 | 21,481 | 21,863 | 22,067 | 21,163 | 21,180 | 21,258 | 21,396 | 20,347 | 20,797 | 20,653 | 21,680 | 21,224 |
| 2017 | 21,692 | 21,112 | 21,122 | 22,313 | 22,302 | 20,561 | 20,150 | 19,688 | 20,402 | 20,275 | 20,411 | 21,044 |
| 2018 | 20,834 | 22,086 | 21,304 | 21,237 | 21,233 | 21,652 | 21,539 | 20,574 | 21,786 | 21,921 | 21,622 | 22,111 |
| 2019 | 21,987 | 21,427 | 21,342 | 20,489 | 22,459 | 22,637 | 22,760 | 23,147 | 23,059 | 21,033 | 22,328 | 23,127 |
| 2020 | 25,737 | 26,595 | 26,711 | 25,293 | 24,951 | 25,411 | 25,590 | 25,640 | 25,204 | 24,004 | 25,230 | 24,674 |
| 2021 | 24,584 | 24,811 | 24,991 | 25,119 | 24,876 | 23,308 | 23,772 | 24,516 | 25,543 | 25,107 | 25,328 | 25,679 |
| 2022 | 25,780 | 25,188 | 24,248 | 24,908 | 23,411 | 23,819 | 24,898 | 24,192 | 24,119 | 23,976 | 24,056 | 23,817 |
| 2023 | 23,628 | 24,970 | 24,779 | 24,877 | 25,514 | 26,555 | 26,831 | 26,842 | 26,948 | 26,292 | 26,521 | 26,457 |
| 2024 | 27,329 | 26,799 | 26,829 | 26,626 | 26,859 | 26,436 | ||||||
| - = No Data Reported; -- = Not Applicable; NA = Not Available; W = Withheld to avoid disclosure of individual company data. |
| Release Date: 8/30/2024 |
| Next Release Date: 9/30/2024 |