|
Download Data (XLS File) |
|
||||||||
|
||||||||
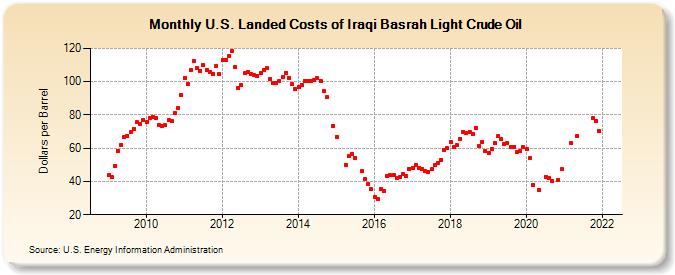
| U.S. Landed Costs of Iraqi Basrah Light Crude Oil (Dollars per Barrel) | ||||||||
| Year | Jan | Feb | Mar | Apr | May | Jun | Jul | Aug | Sep | Oct | Nov | Dec |
|---|---|---|---|---|---|---|---|---|---|---|---|---|
| 2009 | 43.58 | 42.61 | 49.14 | 58.46 | 62.08 | 66.59 | 67.52 | 69.51 | 71.71 | 75.73 | 74.43 | 77.05 |
| 2010 | 75.46 | 78.31 | 79.03 | 78.36 | 73.65 | 73.34 | 73.76 | 76.69 | 76.06 | 81.20 | 84.35 | 92.01 |
| 2011 | 102.25 | 98.56 | 106.81 | 112.40 | 108.48 | 106.64 | 109.84 | 106.94 | 106.00 | 104.69 | 109.43 | 104.68 |
| 2012 | 113.13 | 113.20 | 115.53 | 118.56 | 108.94 | 95.96 | 97.96 | 105.05 | 105.67 | 104.51 | 103.82 | 103.39 |
| 2013 | 105.05 | 107.04 | 107.92 | 101.56 | 99.31 | 99.25 | 100.50 | 103.06 | 105.37 | 102.25 | 98.41 | 95.53 |
| 2014 | 96.74 | 98.18 | 100.65 | 100.42 | 100.45 | 101.06 | 101.97 | 100.68 | 94.12 | 90.49 | W | 73.33 |
| 2015 | 66.83 | W | W | 49.93 | 55.30 | 56.75 | 54.12 | W | 46.17 | 41.74 | 38.67 | 35.18 |
| 2016 | 30.55 | 29.27 | 35.16 | 34.37 | 43.44 | 43.60 | 43.78 | 41.98 | 42.47 | 44.37 | 43.11 | 47.72 |
| 2017 | 48.34 | 50.16 | 48.28 | 47.51 | 46.06 | 45.87 | 47.30 | 49.83 | 51.27 | 53.10 | 58.61 | 60.05 |
| 2018 | 64.01 | 60.97 | 61.65 | 65.78 | 69.98 | 69.31 | 70.02 | 68.65 | 72.38 | 61.55 | 63.76 | 58.25 |
| 2019 | 57.15 | 59.71 | 63.17 | 67.21 | 65.51 | 62.79 | 63.29 | 60.42 | 60.75 | 57.63 | 58.32 | 60.49 |
| 2020 | 59.30 | 53.81 | 38.05 | W | 34.88 | W | 42.97 | 42.30 | 40.32 | W | 41.13 | 47.25 |
| 2021 | W | W | 63.36 | W | 67.04 | W | W | W | W | 78.01 | 76.28 | 70.63 |
| 2022 | W | |||||||||||
| - = No Data Reported; -- = Not Applicable; NA = Not Available; W = Withheld to avoid disclosure of individual company data. |
| Release Date: 8/1/2024 |
| Next Release Date: 9/3/2024 |