|
Download Data (XLS File) |
|
||||||||
|
||||||||
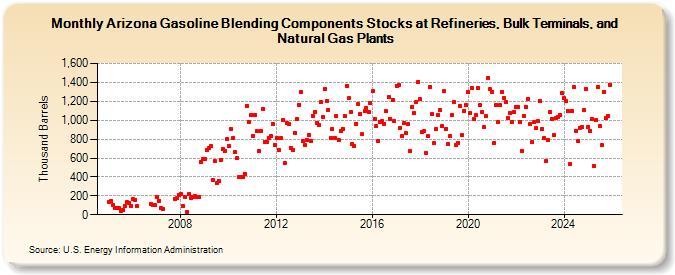
| Arizona Gasoline Blending Components Stocks at Refineries, Bulk Terminals, and Natural Gas Plants (Thousand Barrels) | ||||||||
| Year | Jan | Feb | Mar | Apr | May | Jun | Jul | Aug | Sep | Oct | Nov | Dec |
|---|---|---|---|---|---|---|---|---|---|---|---|---|
| 2005 | 134 | 147 | 98 | 66 | 70 | 67 | 39 | 55 | 91 | 130 | 126 | 91 |
| 2006 | 162 | 156 | 88 | 118 | 103 | 104 | ||||||
| 2007 | 184 | 150 | 71 | 64 | 164 | 174 | 206 | |||||
| 2008 | 224 | 92 | 189 | 31 | 214 | 179 | 184 | 197 | 191 | 187 | 559 | 588 |
| 2009 | 589 | 680 | 703 | 724 | 369 | 564 | 331 | 358 | 581 | 695 | 671 | 803 |
| 2010 | 727 | 911 | 815 | 664 | 595 | 398 | 395 | 399 | 436 | 1,153 | 982 | 1,054 |
| 2011 | 837 | 1,054 | 886 | 670 | 882 | 1,119 | 771 | 766 | 815 | 832 | 965 | 735 |
| 2012 | 812 | 686 | 809 | 997 | 551 | 970 | 958 | 711 | 684 | 861 | 1,011 | 1,161 |
| 2013 | 1,303 | 779 | 736 | 793 | 840 | 785 | 1,045 | 1,085 | 971 | 949 | 1,188 | 1,032 |
| 2014 | 1,325 | 1,198 | 1,109 | 807 | 908 | 812 | 1,043 | 792 | 885 | 911 | 1,041 | 1,363 |
| 2015 | 1,230 | 1,085 | 747 | 728 | 963 | 1,171 | 1,067 | 850 | 1,095 | 1,127 | 1,087 | 1,184 |
| 2016 | 1,305 | 1,016 | 936 | 785 | 983 | 989 | 964 | 1,092 | 1,241 | 1,015 | 1,209 | 993 |
| 2017 | 1,365 | 1,368 | 915 | 832 | 969 | 861 | 959 | 675 | 1,140 | 1,074 | 1,193 | 1,409 |
| 2018 | 1,220 | 879 | 881 | 652 | 829 | 1,355 | 1,064 | 758 | 908 | 1,057 | 1,103 | 938 |
| 2019 | 1,306 | 911 | 751 | 828 | 1,056 | 1,195 | 737 | 764 | 1,149 | 839 | 1,102 | 1,159 |
| 2020 | 1,296 | 1,071 | 1,338 | 1,013 | 1,054 | 1,340 | 1,159 | 1,087 | 923 | 1,044 | 1,448 | 1,326 |
| 2021 | 1,301 | 763 | 1,161 | 986 | 1,156 | 1,300 | 1,238 | 1,192 | 1,019 | 1,077 | 986 | 1,083 |
| 2022 | 1,141 | 1,142 | 985 | 679 | 1,042 | 1,142 | 1,227 | 958 | 767 | 976 | 914 | 987 |
| 2023 | 1,202 | 910 | 808 | 563 | 795 | 1,088 | 1,017 | 842 | 1,023 | 1,038 | 1,053 | 1,283 |
| 2024 | 1,233 | |||||||||||
| - = No Data Reported; -- = Not Applicable; NA = Not Available; W = Withheld to avoid disclosure of individual company data. |
| Release Date: 3/29/2024 |
| Next Release Date: 4/30/2024 |