|
Download Data (XLS File) |
|
||||||||
|
||||||||
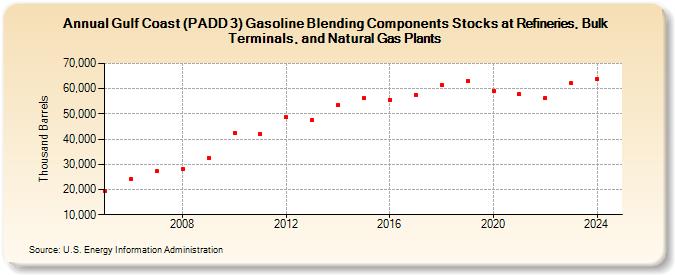
| Gulf Coast (PADD 3) Gasoline Blending Components Stocks at Refineries, Bulk Terminals, and Natural Gas Plants (Thousand Barrels) | ||||||||
| Decade | Year-0 | Year-1 | Year-2 | Year-3 | Year-4 | Year-5 | Year-6 | Year-7 | Year-8 | Year-9 |
|---|---|---|---|---|---|---|---|---|---|---|
| 2000's | 19,303 | 24,357 | 27,166 | 28,243 | 32,672 | |||||
| 2010's | 42,467 | 42,124 | 48,642 | 47,402 | 53,527 | 56,124 | 55,663 | 57,595 | 61,375 | 63,164 |
| 2020's | 59,140 | 57,833 | 56,206 | 62,639 |
| - = No Data Reported; -- = Not Applicable; NA = Not Available; W = Withheld to avoid disclosure of individual company data. |
| Release Date: 3/29/2024 |
| Next Release Date: 8/30/2024 |