|
Download Data (XLS File) |
|
||||||||
|
||||||||
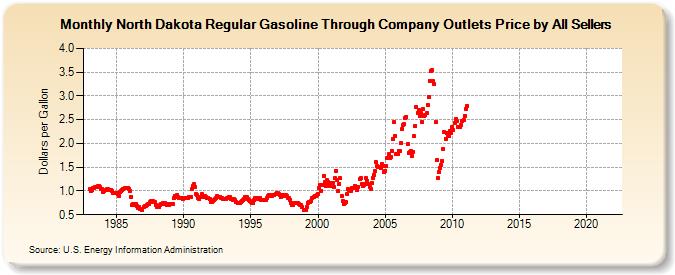
| North Dakota Regular Gasoline Through Company Outlets Price by All Sellers (Dollars per Gallon) | ||||||||
| Year | Jan | Feb | Mar | Apr | May | Jun | Jul | Aug | Sep | Oct | Nov | Dec |
|---|---|---|---|---|---|---|---|---|---|---|---|---|
| 1983 | 1.035 | 1.000 | 1.030 | 1.071 | 1.059 | 1.090 | 1.093 | 1.094 | 1.103 | 1.082 | 1.048 | 1.034 |
| 1984 | 0.984 | 1.002 | 1.029 | 1.036 | 1.038 | 1.029 | 1.029 | 1.023 | 0.995 | 0.964 | 0.951 | 0.967 |
| 1985 | 0.957 | 0.939 | 0.897 | 0.988 | 1.005 | 1.026 | 1.036 | 1.052 | 1.063 | 1.057 | 1.066 | 1.046 |
| 1986 | 0.997 | 0.881 | 0.707 | 0.719 | 0.707 | 0.734 | 0.676 | 0.645 | 0.670 | 0.618 | 0.628 | 0.598 |
| 1987 | 0.665 | 0.674 | 0.675 | 0.707 | 0.729 | 0.735 | 0.760 | 0.790 | 0.786 | 0.762 | 0.759 | 0.708 |
| 1988 | 0.670 | 0.661 | 0.669 | 0.695 | 0.731 | 0.738 | 0.731 | 0.754 | 0.720 | 0.694 | 0.715 | 0.701 |
| 1989 | 0.731 | 0.722 | 0.726 | 0.845 | 0.895 | 0.878 | 0.908 | 0.868 | 0.858 | 0.861 | 0.846 | 0.827 |
| 1990 | 0.848 | 0.859 | 0.850 | 0.849 | 0.849 | 0.876 | 0.876 | 1.037 | 1.106 | 1.137 | 1.082 | 0.942 |
| 1991 | 0.914 | 0.843 | 0.821 | 0.881 | 0.926 | 0.882 | 0.892 | 0.894 | 0.863 | 0.853 | 0.850 | 0.826 |
| 1992 | 0.762 | 0.760 | 0.784 | 0.816 | 0.830 | 0.861 | 0.888 | 0.878 | 0.873 | 0.859 | 0.854 | 0.840 |
| 1993 | 0.830 | 0.828 | 0.840 | 0.862 | 0.863 | 0.864 | 0.835 | 0.832 | 0.817 | 0.834 | 0.804 | 0.773 |
| 1994 | 0.751 | 0.748 | 0.737 | 0.772 | 0.794 | 0.804 | 0.835 | 0.880 | 0.872 | 0.840 | 0.810 | 0.782 |
| 1995 | 0.765 | 0.757 | 0.752 | 0.800 | 0.854 | 0.851 | 0.838 | 0.838 | 0.844 | 0.819 | 0.807 | 0.806 |
| 1996 | 0.809 | 0.815 | 0.845 | 0.895 | 0.920 | 0.909 | 0.896 | 0.901 | 0.909 | 0.914 | 0.939 | 0.957 |
| 1997 | 0.956 | 0.937 | 0.913 | 0.882 | 0.894 | 0.910 | 0.891 | 0.908 | 0.891 | 0.853 | 0.845 | 0.813 |
| 1998 | 0.753 | 0.708 | 0.714 | 0.753 | 0.738 | 0.738 | 0.738 | 0.726 | 0.703 | 0.699 | 0.662 | 0.595 |
| 1999 | 0.600 | 0.606 | 0.661 | 0.753 | 0.776 | 0.761 | 0.796 | 0.846 | 0.873 | 0.889 | 0.896 | 0.908 |
| 2000 | 0.944 | 1.065 | 1.118 | 1.005 | 1.123 | 1.320 | 1.193 | 1.106 | 1.221 | 1.197 | 1.161 | 1.103 |
| 2001 | 1.162 | 1.176 | 1.093 | 1.267 | 1.430 | 1.241 | 0.994 | 1.155 | 1.265 | 0.904 | 0.794 | 0.719 |
| 2002 | 0.751 | 0.763 | 0.939 | 1.044 | 1.026 | 1.009 | 1.056 | 1.069 | 1.061 | 1.109 | 1.059 | 1.017 |
| 2003 | 1.082 | 1.245 | 1.264 | 1.142 | 1.110 | 1.122 | 1.138 | 1.272 | 1.218 | 1.156 | 1.078 | 1.044 |
| 2004 | 1.167 | 1.277 | 1.343 | 1.413 | 1.599 | 1.535 | 1.499 | 1.500 | 1.491 | 1.572 | 1.522 | 1.407 |
| 2005 | 1.426 | 1.521 | 1.688 | 1.769 | 1.698 | 1.725 | 1.845 | 2.101 | 2.453 | 2.161 | 1.783 | 1.773 |
| 2006 | 1.849 | 1.832 | 2.003 | 2.295 | 2.382 | 2.406 | 2.545 | 2.564 | 1.992 | 1.804 | 1.817 | 1.851 |
| 2007 | 1.733 | 1.826 | 2.149 | 2.371 | 2.769 | 2.648 | 2.712 | 2.578 | 2.638 | 2.449 | 2.716 | 2.580 |
| 2008 | 2.589 | 2.637 | 2.805 | 2.982 | 3.318 | 3.531 | 3.538 | 3.307 | 3.245 | 2.441 | 1.644 | 1.277 |
| 2009 | 1.394 | 1.489 | 1.552 | 1.639 | 1.879 | 2.237 | 2.101 | 2.213 | 2.159 | 2.149 | 2.266 | 2.221 |
| 2010 | 2.340 | 2.287 | 2.423 | 2.511 | 2.465 | 2.353 | 2.340 | 2.354 | 2.381 | 2.468 | 2.495 | 2.581 |
| 2011 | 2.725 | 2.798 | - | - | - | - | - | - | - | - | - | - |
| 2012 | - | - | - | - | - | - | - | - | - | - | - | - |
| 2013 | - | - | - | - | - | - | - | - | - | - | - | - |
| 2014 | - | - | - | - | - | - | - | - | - | - | - | - |
| 2015 | - | - | - | - | - | - | - | - | - | - | - | - |
| 2016 | - | - | - | - | - | - | - | - | - | - | - | - |
| 2017 | - | - | - | - | - | - | - | - | - | - | - | - |
| 2018 | - | - | - | - | - | - | - | - | - | - | - | - |
| 2019 | - | - | - | - | - | - | - | - | - | - | - | - |
| 2020 | - | - | - | - | - | - | - | - | - | - | - | - |
| 2021 | - | - | - | - | - | - | - | - | - | - | - | - |
| 2022 | - | - | - | |||||||||
| - = No Data Reported; -- = Not Applicable; NA = Not Available; W = Withheld to avoid disclosure of individual company data. |
| Release Date: 6/1/2022 |
| Next Release Date: TBD |